Navigate the Macro Investing Cycle with a Systematic Map.
LOGIC Macro Regime converts sophisticated macro strategy into a systematic positioning tool. Trusted by institutional investors.
Stop guessing, navigate. Know where we are in the cycle, what regime is in play, and how to strategically position portfolio allocation and risk.
Delivered as a clear Monthly Macro Map.
Example Monthly Macro Map sent to subscribers before the month begins.
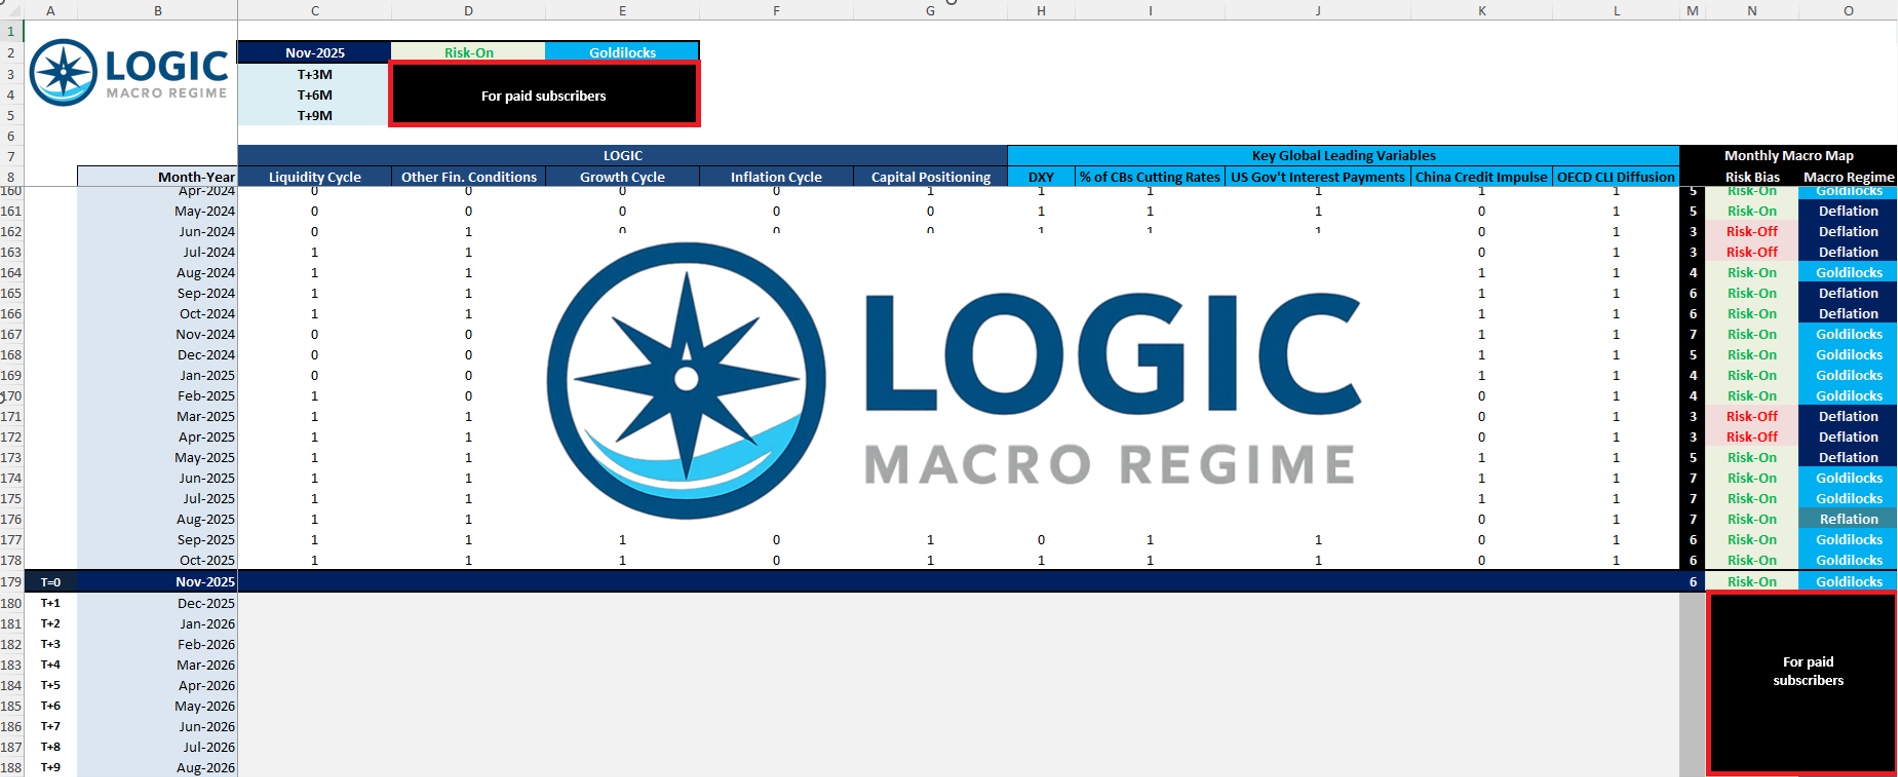
Real previously issued Monthly Macro Map • For evaluation purposes
LOGIC Framework: your macro map
The frameworkShort explainer video: How LOGIC Macro Regime works
LOGIC Macro Regime distills nearly two decades of institutional macro and investment management experience into a simple framework to effectively read macro and market signals.
Proprietary indicators anchored on the Liquidity Cycle, Other Financial Conditions and Capital Positioning ("LOC" of LOGIC) are analyzed with key global leading variables – the US Dollar, US Government Interest Payments, the Proportion of Central Banks Cutting Rates, the OECD CLI Diffusion Index and the China Credit Impulse Index to identify if there are headwinds or tailwinds to the risk bias. The Growth Cycle and Inflation Cycle ("GI" of LOGIC) segment the Macro Regime – the sea conditions.
The result is a Monthly Macro Map that provides investors a strategic, macro overlay for portfolio management decisions to help align with assets, sectors and style factors most likely to outperform. Its designed to keep savvy investors disciplined, objective and systematic as they navigate through macro waters. The models and seven switch indicators behind LOGIC are proprietary – you get the signal, not the wiring.
Macro Regimes: the four seas
REGIMES + RISK SCOREEach Macro Regime is defined by the acceleration ↑ or deceleration ↓ of the Growth (G) and Inflation (I) cycles. Those simple directions segment the macro ocean into four distinct seas.
What tends to outperform / underperform in each regime?
Style factors & sectorsBelow is a list of how major equity style factors, sectors and fixed income categories have tended to behave in each LOGIC Macro Regime. Historical tendencies only – not a guarantee of future results and not investment advice.
- High Beta
- Small Caps
- Mega Cap Growth
- Cyclicals
- Mid Caps
- Low Beta
- Defensives
- Size
- Quality
- Dividends
- Consumer Discretionary
- Financials
- Technology
- Materials
- Industrials
- Utilities
- Communication Services
- Real Estate
- Consumer Staples
- Health Care
- Business Development Co. Loans
- Convertibles
- High Yield Credit
- Emerging Markets $ Debt
- Preferreds
- Long Duration Bonds 10yr+
- 0–5yr TIPS
- Mid Duration Bonds 2-10yr
- Mortgage Backed Securities
- 5–10yr TIPS
- Mega Cap Growth
- High Beta
- Cyclicals
- Momentum
- Small Caps
- Low Beta
- Dividends
- Defensives
- Quality
- Large Caps
- Technology
- Industrials
- Consumer Discretionary
- Financials
- Energy
- Real Estate
- Consumer Staples
- Utilities
- Communication Services
- Health Care
- Business Development Co. Loans
- Convertibles
- Preferreds
- High Yield Credit
- Emerging Markets Local Currency
- Long Duration Bonds 10yr+
- Mid Duration Bonds 2-10yr
- Investment Grade Credit
- Mortgage Backed Securities
- Short Rates
- Low Beta
- Mega Cap Growth
- Quality
- Dividends
- Defensives
- High Beta
- Small Caps
- Cyclicals
- Value
- Mid Caps
- Utilities
- Health Care
- Real Estate
- Consumer Staples
- Communication Services
- Energy
- Materials
- Financials
- Industrials
- Consumer Discretionary
- Long Duration Bonds 10yr+
- Emerging Markets $ Debt
- 5–10yr TIPS
- Mid Duration Bonds 2-10yr
- Investment Grade Credit
- Business Development Co. Loans
- Convertibles
- High Yield Credit
- Mortgage Backed Securities
- Leveraged Loans
- Dividends
- Low Beta
- Quality
- Defensives
- Growth
- High Beta
- Cyclicals
- Value
- Small Caps
- Mid Caps
- Real Estate
- Health Care
- Consumer Staples
- Utilities
- Consumer Discretionary
- Financials
- Industrials
- Technology
- Communication Services
- Energy
- Long Duration Bonds 10yr+
- Mid Duration Bonds 2-10yr
- Investment Grade Credit
- Mortgage Backed Securities
- Short Rates
- Preferreds
- Business Development Co. Loans
- Leveraged Loans
- High Yield Credit
- Emerging Markets Local Currency
One simple subscription. That’s it.
SubscribeLOGIC Macro Regime is intentionally minimal. One signal, once a month, focused on what actually matters for portfolio performance: where financial markets are in the macro cycle and what each of the next 6 months will look like.
What paid subscribers receive each month
No courses, no short-term trade alerts. Just a clear Monthly Macro Map to help you prepare whether to drop anchor, batten down the hatches, or stay the course. Embark on your macro voyage today.
FAQ
Common questionsWhat is LOGIC Macro Regime?
LOGIC Macro Regime is a quantitative and systematic framework that translates institutional macro research into a simple monthly positioning tool. It summarizes where we are in the macro cycle, what regime is in play, and what the next 6 months likely look like.
What do I receive each month?
You receive the Monthly Macro Map (Excel) including: (1) the current LOGIC Macro Regime (Goldilocks / Reflation / Inflation / Deflation), (2) the 0–7 Risk Bias Score, (3) a 6-month forward outlook, and (4) the updated historical matrix back to September 2011.
How often is it updated?
Once per month. LOGIC is designed to be slow-moving and systematic - it’s a strategic macro overlay, not a day-trading signal.
What is the 0–7 Risk Bias Score?
The Risk Bias Score aggregates seven proprietary on/off indicators into a single score from 0–7. Higher scores indicate more supportive macro conditions for risk assets. If 4 or more switches are on, the bias is Risk-On; if 3 or fewer, Risk-Off.
Is this investment advice?
No. LOGIC Macro Regime is for informational and educational purposes only. It does not constitute investment advice, and you are solely responsible for your own investment decisions.
Can I cancel anytime?
Yes. Your subscription is managed securely through Stripe, and you can cancel at any time.
How do I contact you or request a sample?
Click on the "Download December 2025 Sample MMM" button above on the site or email monthlymacromap@logicmacroregime.com and we’ll help you out.
Contact Us
Questions & inquiriesQuestions or to find out more about LOGIC Macro Regime. Email: monthlymacromap@logicmacroregime.com