2011–2026
S&P sector behavior from September 2011 through March 2026.

Most portfolios are built for markets that keep rewarding risk. This page shows what the historical data looks like when you separate the environment into Risk-On and Risk-Off instead of averaging everything together.
The point is not to call every market move. The point is to avoid owning a portfolio that is mismatched with the environment. In Risk-On periods, broad equity exposure and cyclicals are generally rewarded. In Risk-Off periods, returns usually slow, volatility rises, and portfolios often become far less efficient.
That is the key takeaway from the back-test. For the S&P 500, average monthly return drops from 1.5% in Risk-On to 0.8% in Risk-Off, while volatility rises from 3.7% to 4.7%. Return per unit of risk falls from 0.41 to 0.17. The damage is not always a crash. Often it is prolonged undercompensated risk.
The sectors that tend to hold up best in Risk-Off are the defensive core: Healthcare, Consumer Staples, and Utilities, with Energy as the notable exception when the stress is driven by supply-side shocks. By contrast, Technology, Consumer Discretionary, Industrials, and Materials tend to see a much larger deterioration in efficiency when the risk bias turns.
Explore a representative sample across currencies, fixed income, equities and commodities. Paid subscribers unlock all 52 investments, custom dates, the complete leaderboard and the full regime heatmap.
Historical period: September 2011 through March 2026.
Unlock all 52 investments, eight environment views, custom dates, the full heatmap, and the current LOGIC Macro Regime.
This table shows how major S&P sectors (ETF ticker tested) performed.
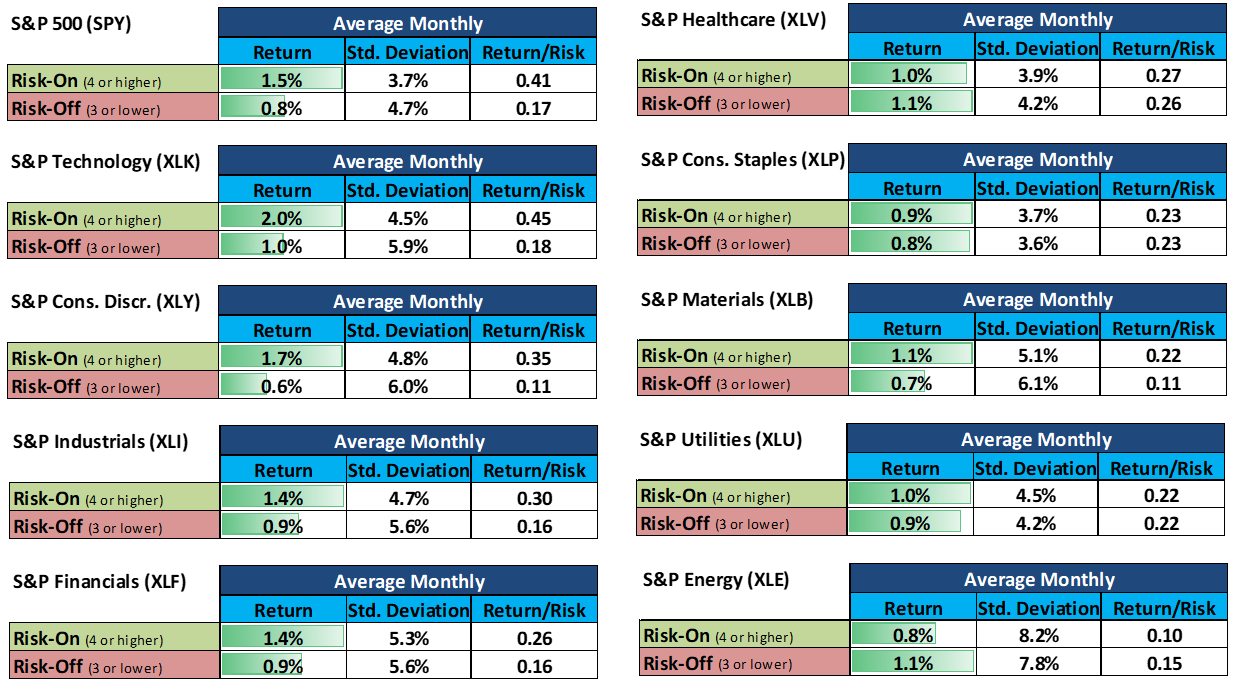
Below is a list of how style factors and sectors have tended to behave in each macro regime. Historical tendencies only, not a guarantee of future results and not investment advice.
Overweight and underweight positioning across the eight macro environments.
Investors usually spend too much time trying to pick the right asset and not enough time asking whether that asset fits the regime. The bigger source of underperformance is often not being wrong on a stock. It is being wrong on the environment.
The Monthly Macro Map is designed to classify the environment ahead of time so you can stay invested with exposures that better match the Macro Regime and Risk Bias instead of reacting after the fact.