The proliferation of high-frequency economic data has resulted in a signal-to-noise ratio that increasingly obscures structural macro trends. In the current era, the modern investor is bombarded with a relentless stream of information: Consumer Price Index (CPI) prints, Gross Domestic Product (GDP) revisions, Federal Reserve "dot plot" shifts, and real-time updates on labor market tightness. We live in an age where the average retail trader has 24/7 access to the same headline data that once resided exclusively on institutional Bloomberg terminals. Yet, paradoxically, this abundance of information has not led to better investment outcomes. Instead, it has fostered a state of perpetual "macro-paralysis" or, worse, reactive decision-making.
The central problem facing the investment community is not a lack of data, but the absence of a disciplined, systematic framework to interpret it. Without a cohesive model, every economic release becomes a disconnected puzzle piece. Investors find themselves pivoting their entire portfolio strategy based on a single "beat" or "miss" in the non-farm payroll report, failing to realize that individual data points are often noise within a much larger, more complex system.
To navigate the modern market, one must shift from being a consumer of headlines to a synthesizer of macro regimes. The goal is not to know what happened yesterday, but to understand the interaction between liquidity, growth, and inflation to determine where the cycle is heading six months from now.
The Mirage of the "Single Indicator" Strategy
A foundational error in both retail and professional circles is the tendency to fixate on a single variable in isolation. This "siloed" approach assumes a linear relationship between an indicator and a market reaction. For example, a common narrative suggests that "if the Fed cuts rates, stocks must go up." However, this fails to account for the broader macro environment. A rate cut in a regime of accelerating growth and stable liquidity is a tailwind; a rate cut during a period of rapidly decelerating credit and a deteriorating labor market is often a desperate response to a systemic shock.
Institutional-quality research focuses on the "transmission mechanisms" of monetary policy rather than just the headline federal funds rate. To understand the true impact of the Federal Reserve, one must look at the interplay between Treasury yields, real rates (nominal rates adjusted for inflation expectations), and the shape of the yield curve. Real rates, in particular, serve as a barometer for the "tightness" of the economy. If nominal rates remain stagnant while inflation expectations fall, real rates rise, effectively tightening financial conditions without the Fed moving a muscle.
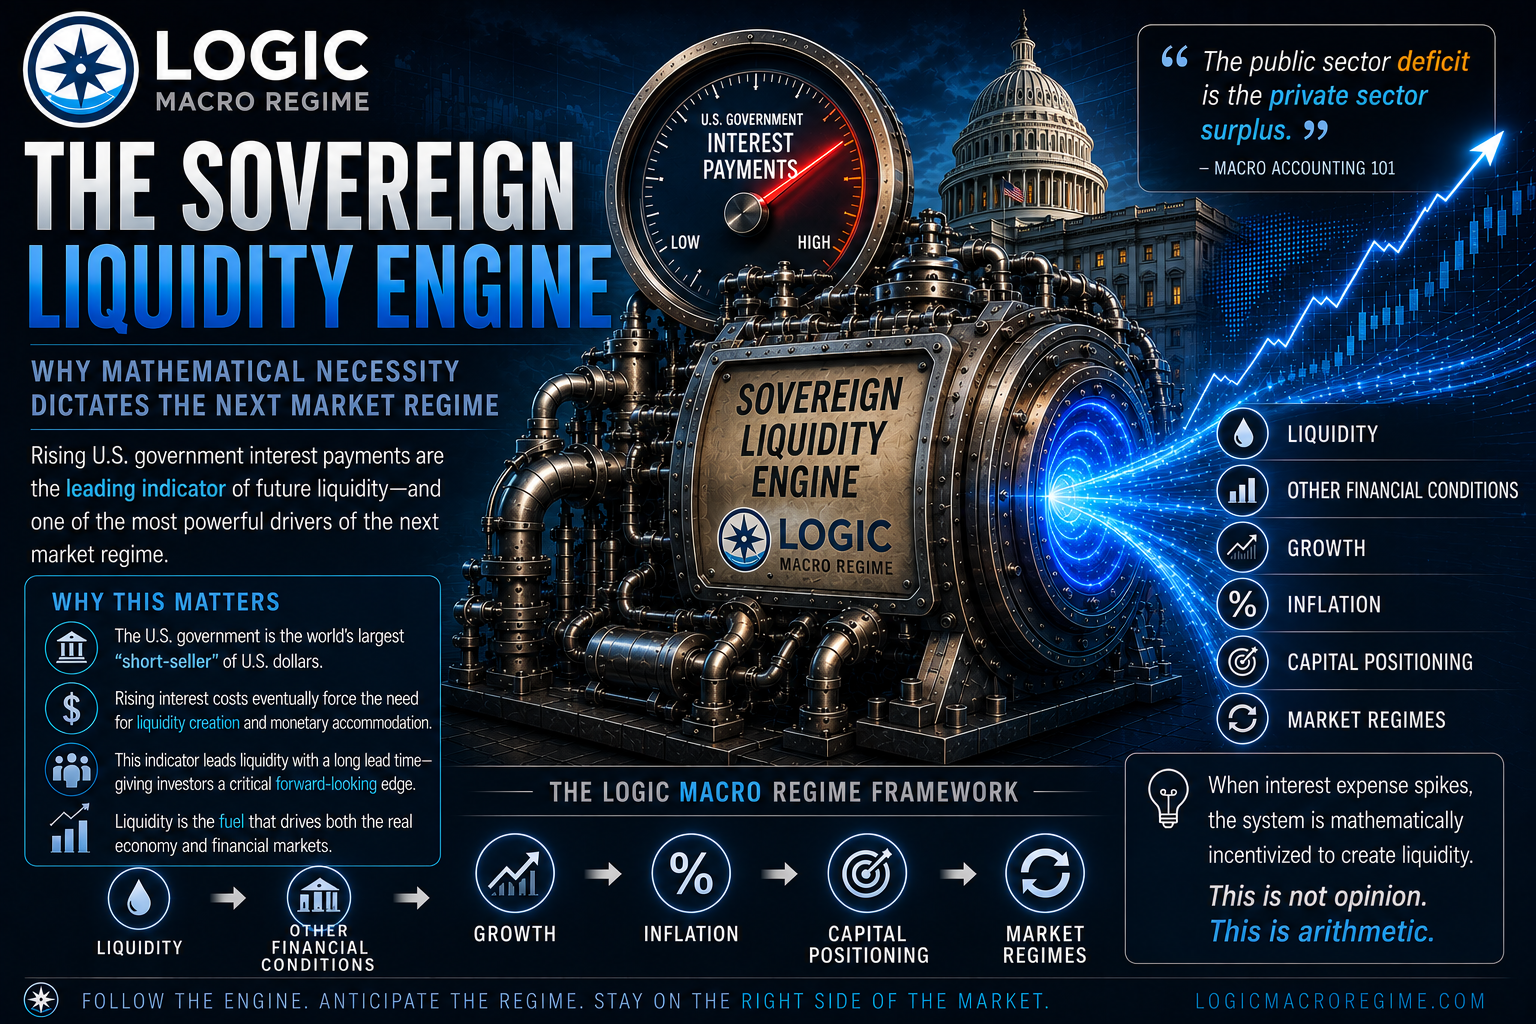
Furthermore, the shift from Quantitative Easing (QE) to Quantitative Tightening (QT) represents a structural change in global liquidity that a simple interest rate chart cannot capture. When the central bank’s balance sheet is expanding, it provides a "liquidity backstop" that can mask underlying economic weakness. Conversely, during QT, the margin for error in the economy vanishes.
"Looking at one variable without understanding how it interacts with the others often creates more confusion than clarity."
By obsessing over a single Federal Reserve meeting or a specific Treasury auction, investors miss the systemic interactions. The macro environment is a complex, adaptive system. To isolate one variable - whether it be the "inverted yield curve" or "core inflation" - and treat it as a definitive crystal ball is a strategic failure. Sophisticated investors understand that variables do not function in a vacuum; they reinforce or contradict one another in a constant state of flux.
Why the Most Popular Data is Often the Most Useless
Financial media tends to prioritize data that is easy to narrate, such as GDP or the monthly unemployment rate. However, for a forward-looking investor, these are frequently the most useless indicators because they are structurally designed to be lagging or, at best, coincident. GDP is essentially a rearview mirror; it is a lagging confirmation of economic activity that has already occurred. By the time a "soft landing" or a "recession" is officially confirmed in the GDP print, the market has usually already priced in the next phase of the cycle.
The labor market is another prime example of a misleading indicator. Data points like Non-farm Payrolls, Jobless Claims, and the Unemployment Rate receive immense attention, yet employment is typically one of the last parts of the economy to turn. This is due to "labor hoarding" - firms are structurally slow to fire employees at the start of a downturn because of the high costs of hiring and training. They wait until the downturn is undeniable before cutting staff. Consequently, if you wait for the unemployment rate to spike before de-risking your portfolio, you are reacting to an event that is the result of economic contraction, not the cause of it.
The Danger of Chasing Economic Headlines
To gain a competitive edge, one must distinguish between "late" indicators and "early warning signals." While the consumer and the labor market are the final dominoes to fall, other sectors provide much earlier clues:
Manufacturing and PMIs: The Purchasing Managers’ Index (PMI) and ISM reports reflect the real-time sentiment and order books of businesses. Manufacturing is highly cyclical and sensitive to interest rates, making it a reliable lead indicator for the broader business cycle.
Housing Starts and Building Permits: Housing is a primary transmission mechanism for monetary policy. Because housing requires significant long-term financing, it is the "canary in the coal mine" for interest rate sensitivity. When building permits start to decline, it signals a slowdown in construction employment, durable goods orders, and retail spending months down the line.
Inventory Cycles: Durable goods orders and industrial production give us a window into the "supply" side of the economy. When inventories build up because consumer spending is slowing, a production cut is inevitable, which eventually leads to those lagging layoffs in the labor market.
Relying on retail sales or consumer confidence - data that reflects what has already happened in the household - forces an investor into a reactive stance. The goal is to identify the inflection points in manufacturing and housing before they manifest in the broader GDP or payroll reports.
Markets Move on the Future, Not the Present
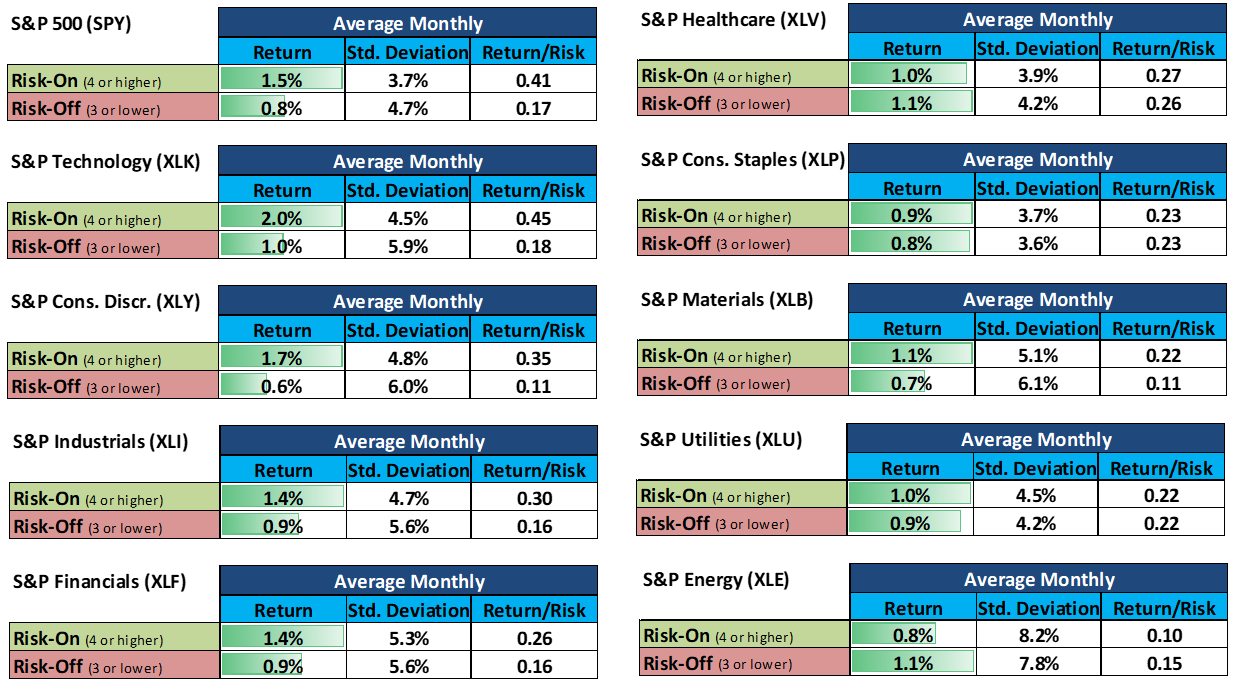
The most difficult concept for many investors to internalize is that financial markets are discounting mechanisms. They do not trade on today’s reality; they trade on the collective expectation of what the world will look like in six to nine months. This explains why the equity market often rallies when economic data is seemingly "bad." If the data is bad enough to force a pivot in liquidity or monetary policy, the market discounts the future improvement in conditions rather than the current economic pain.
This is where "Market Internals" become critical. Indicators like Credit Spreads, the VIX (Volatility Index), and the US Dollar serve as real-time gauges of risk appetite and systemic stress.
Credit Spreads: When the gap between corporate bond yields and safe-haven Treasuries widens, it signals that the market is sensing a rise in default risk, regardless of what the "official" economic growth numbers say.
The US Dollar: In a global macro context, the Dollar is a primary indicator of global liquidity. A strengthening Dollar often acts as a "wrecking ball," tightening financial conditions for emerging markets and global trade.
Volatility and the VIX: Volatility isn't just a measure of fear; it is a measure of the market’s uncertainty about the forward macro regime.
Knowing today’s CPI number is statistically less valuable than understanding where the macro cycle will be in two quarters. Whether it is a "beat" or a "miss" against consensus expectations, the reaction depends entirely on the market’s current positioning and what it has already "priced in." If everyone is positioned for a "soft landing," even a slightly negative growth print can cause a violent re-pricing.
To succeed, one must move beyond headline analysis and focus on the "Macro Map"- the path the economy is taking from one regime to another.
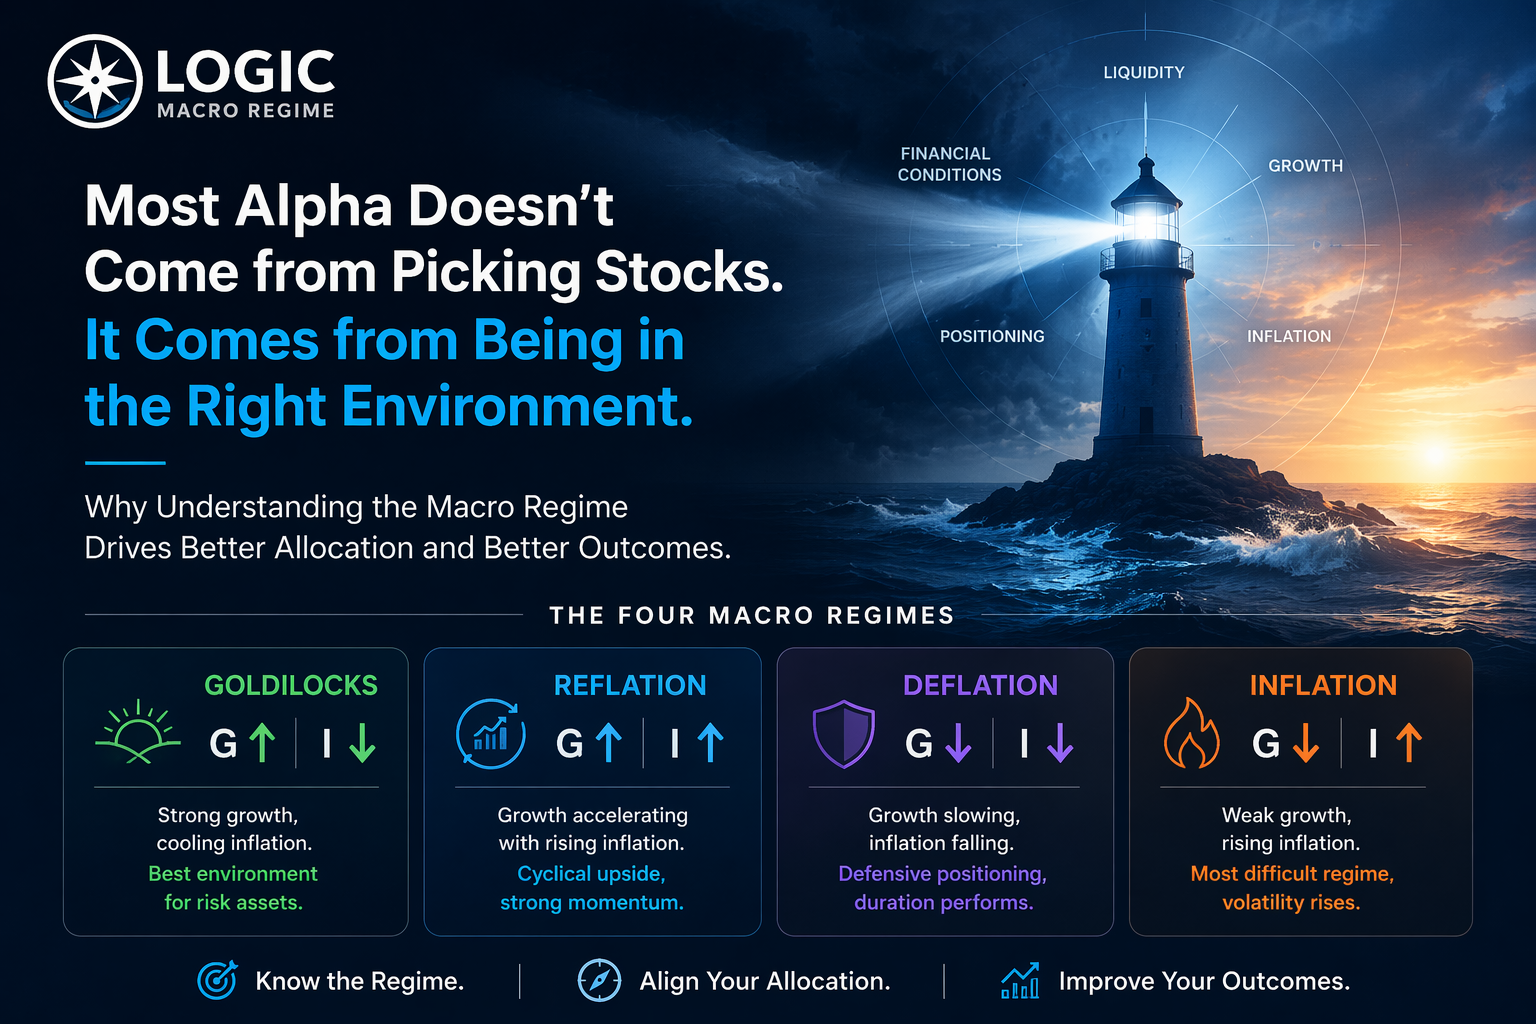
The "LOGIC" of Systemic Interactions
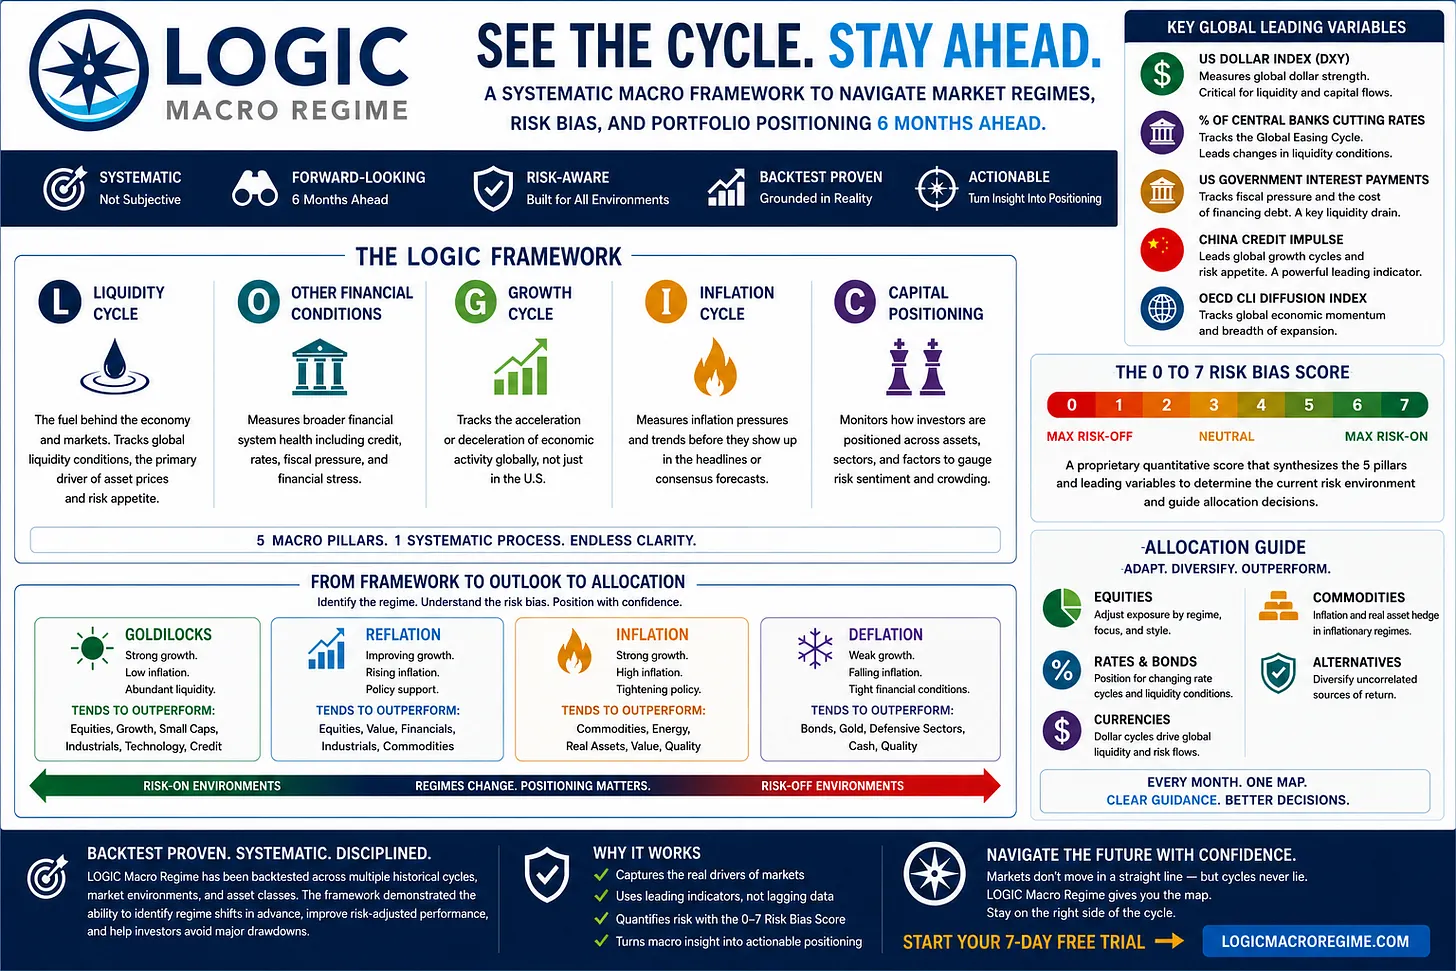
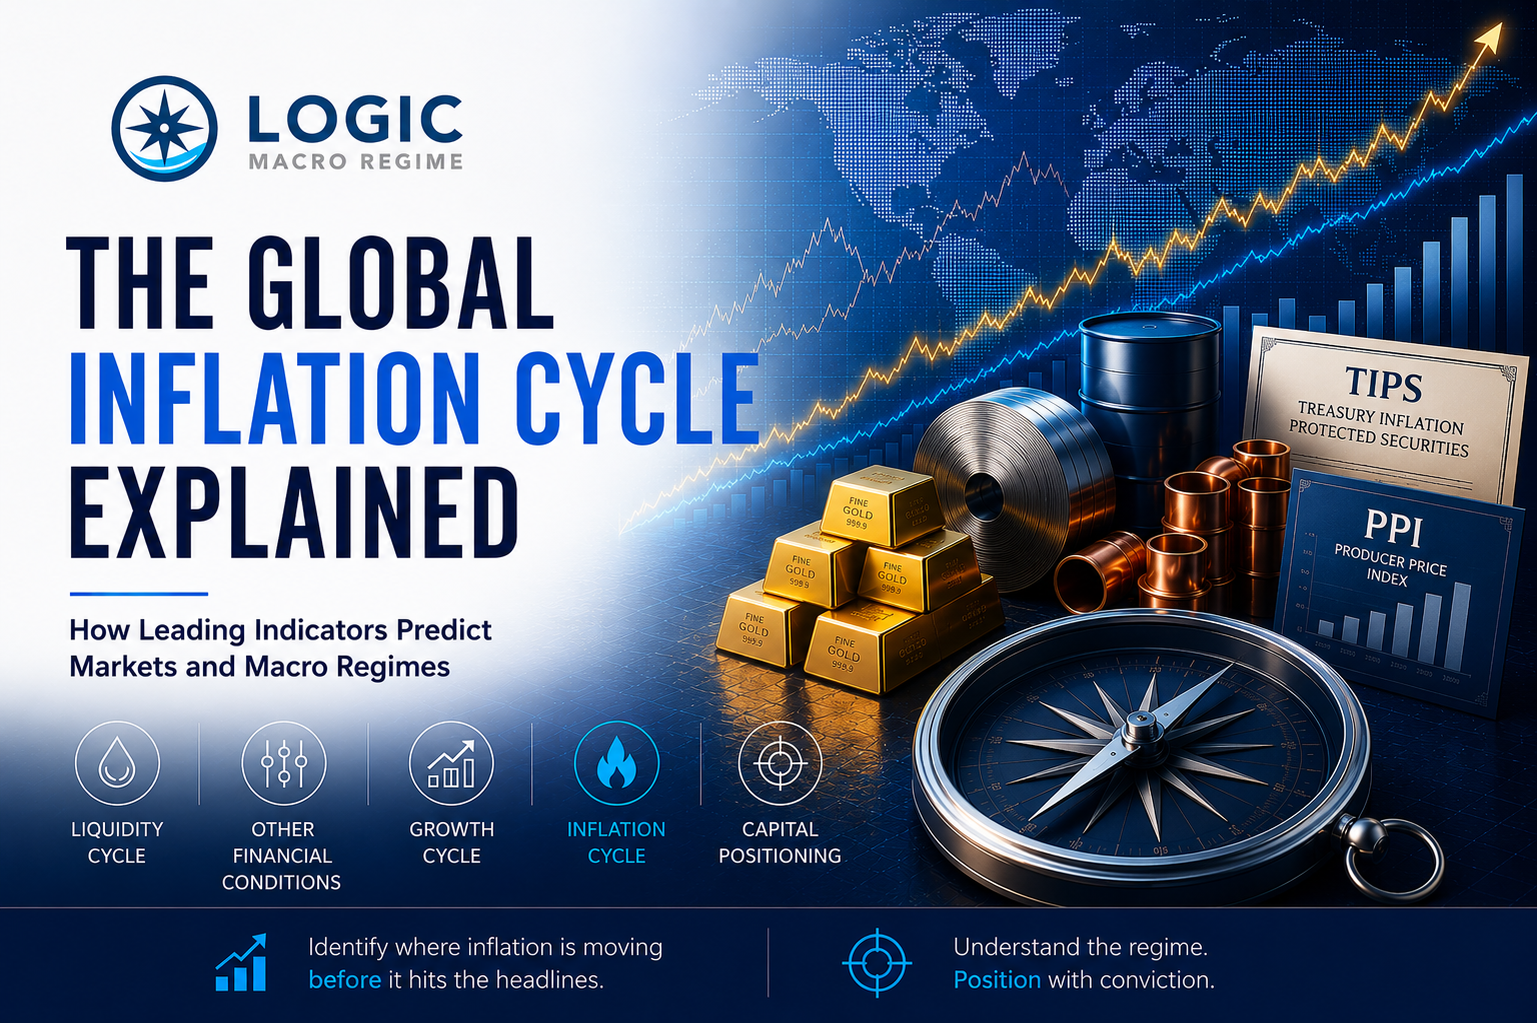
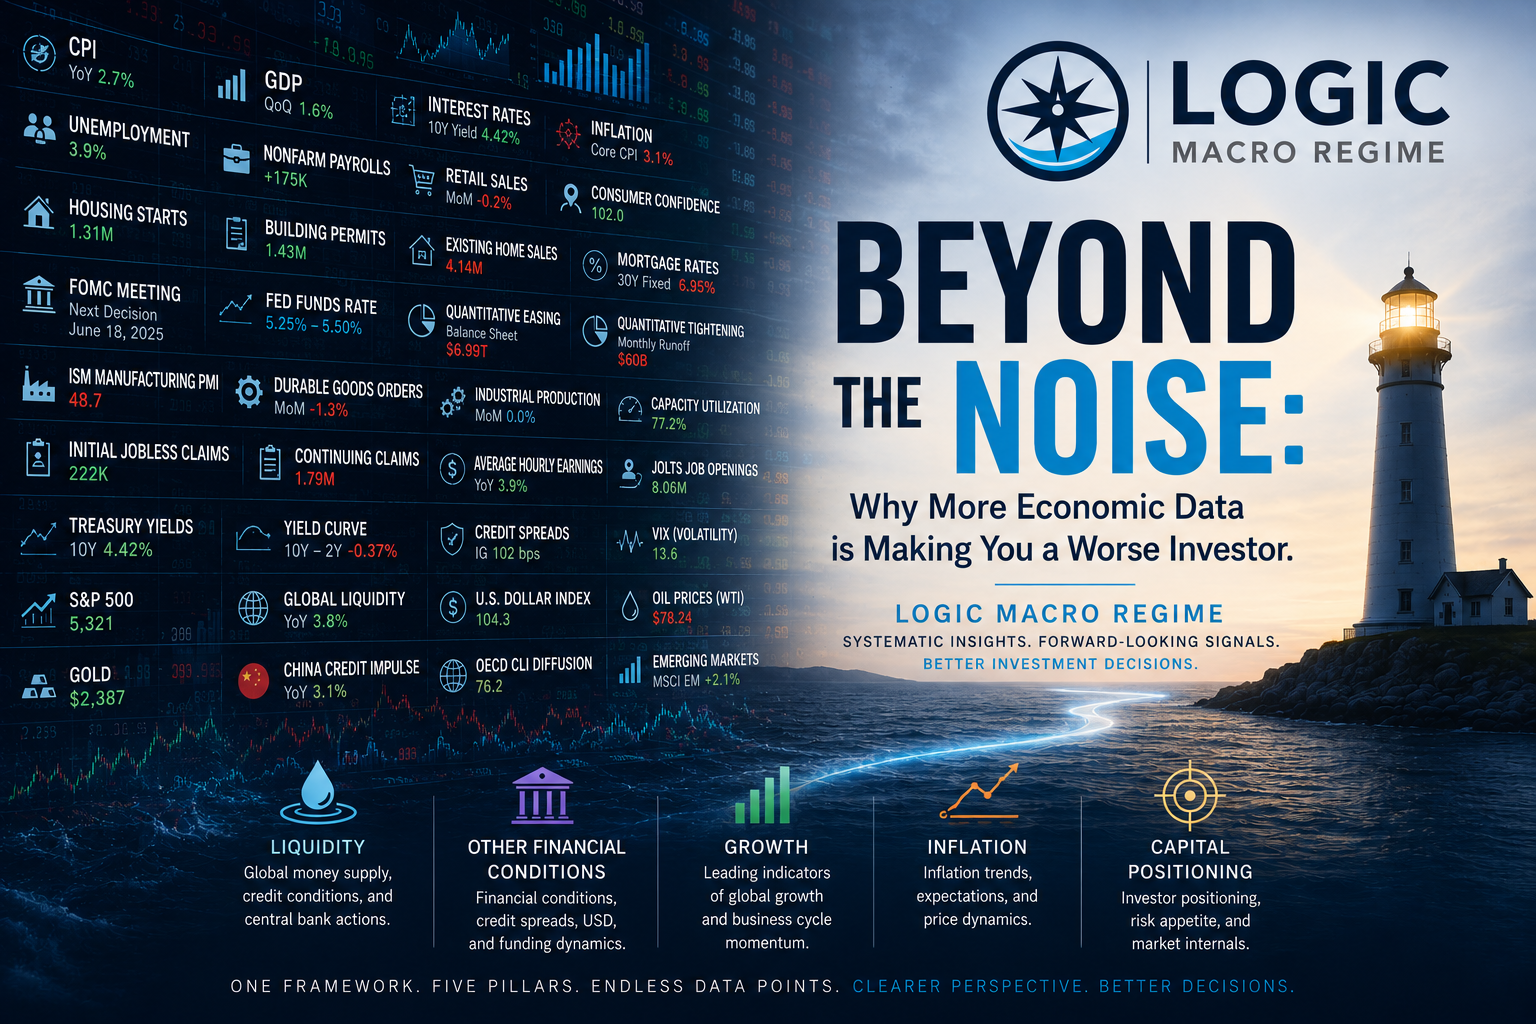
To solve the problem of information overload, we utilize a framework that distills the noise into five statistically tested pillars. These are not independent silos; they are the gears of the macro machine. We call this the LOGIC framework.
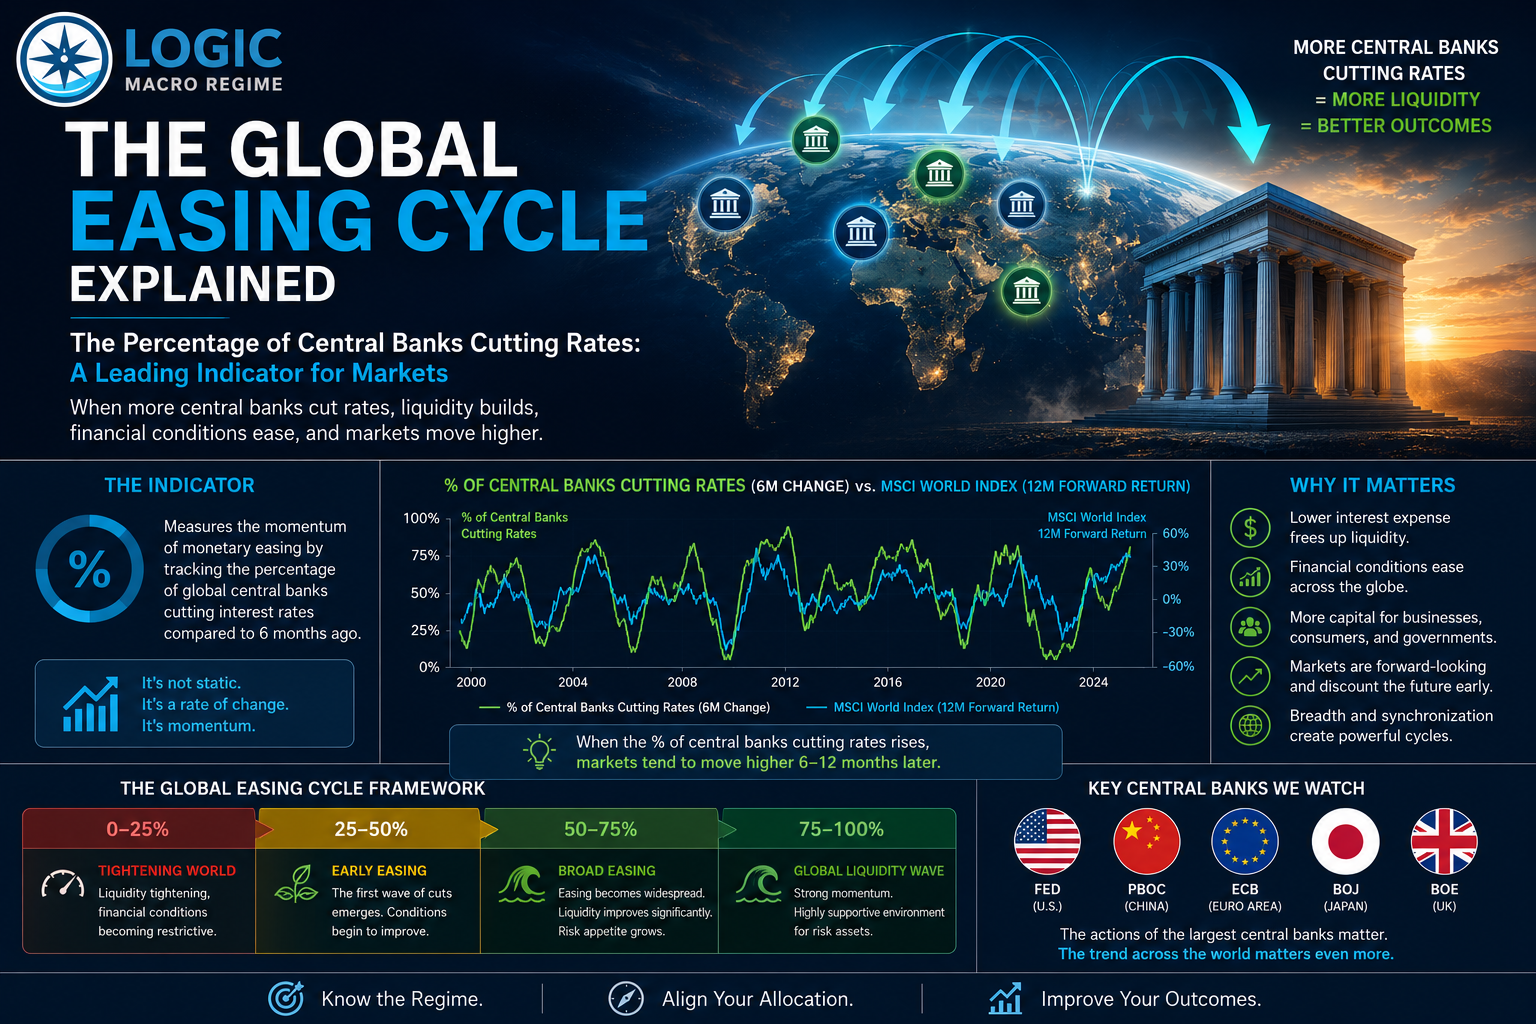
L - Liquidity: This is the most important driver of asset prices. It refers to the total volume of money and credit flowing through the global system. We look beyond the Fed to Global Liquidity and specifically the China Credit Impulse. China, as the world’s largest consumer of commodities and a major driver of global manufacturing, often leads the global cycle through its credit expansion or contraction. When China "injects" credit, it ripples through global PMIs and commodity markets with a predictable lead time.
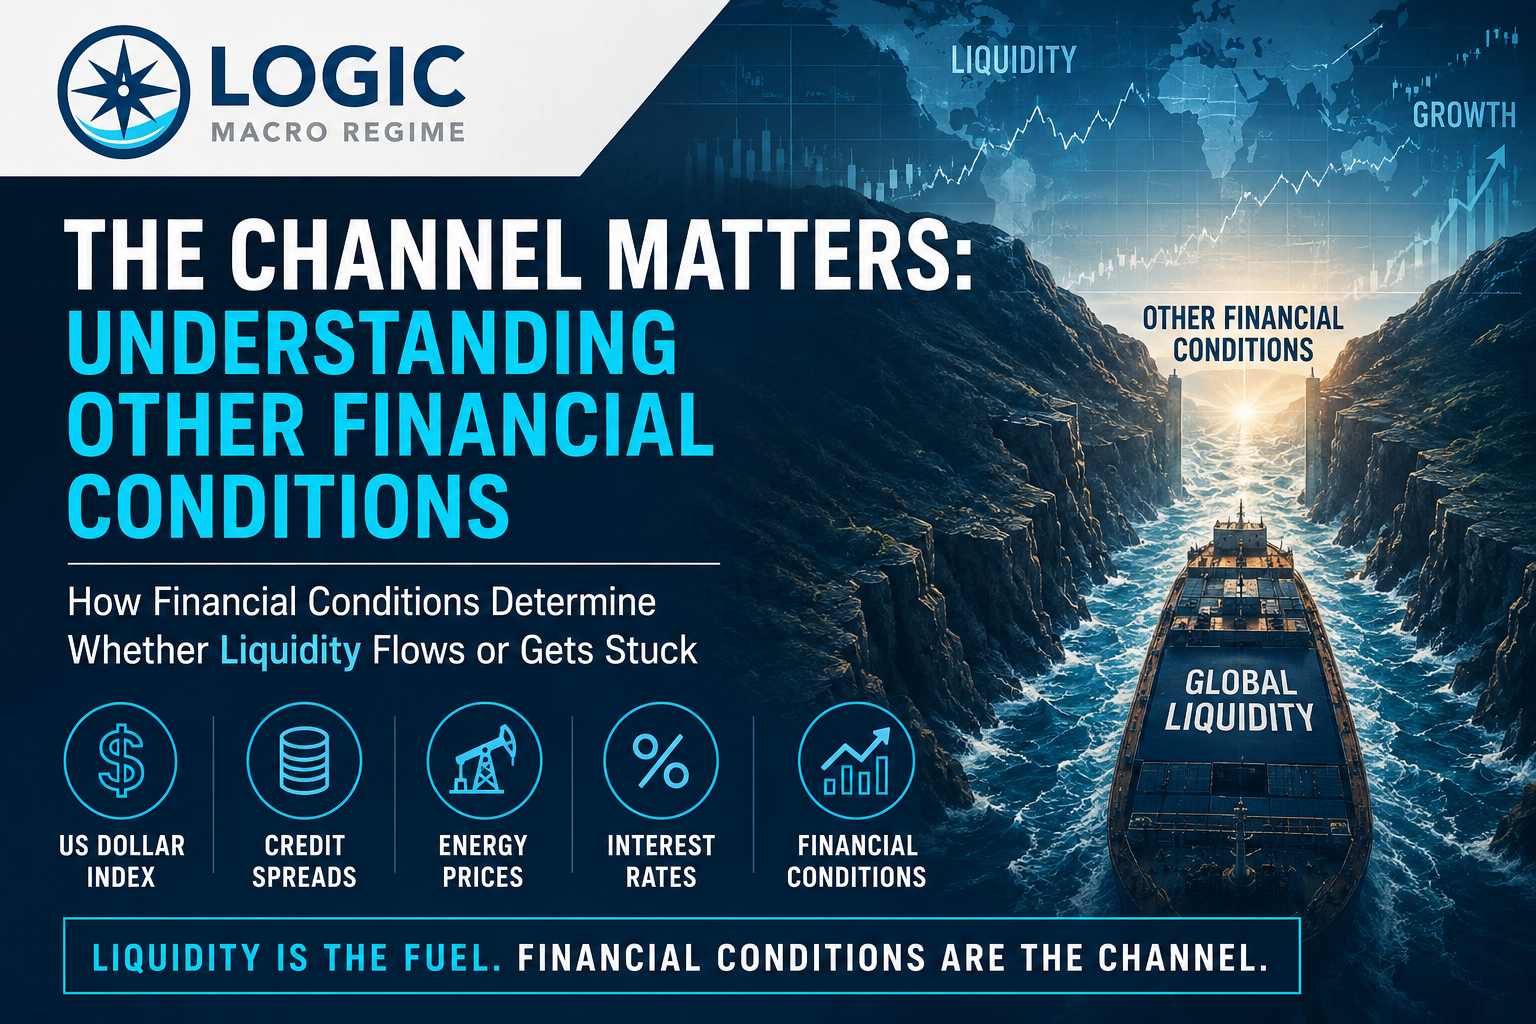
O - Other Financial Conditions: This pillar tracks the "cost" of money and the ease of funding. It includes the US Dollar, credit spreads, and government interest expenses. Even if growth is high, if the "Other Financial Conditions" are tightening (e.g., a surging Dollar or widening spreads), the net effect on the economy can be restrictive.
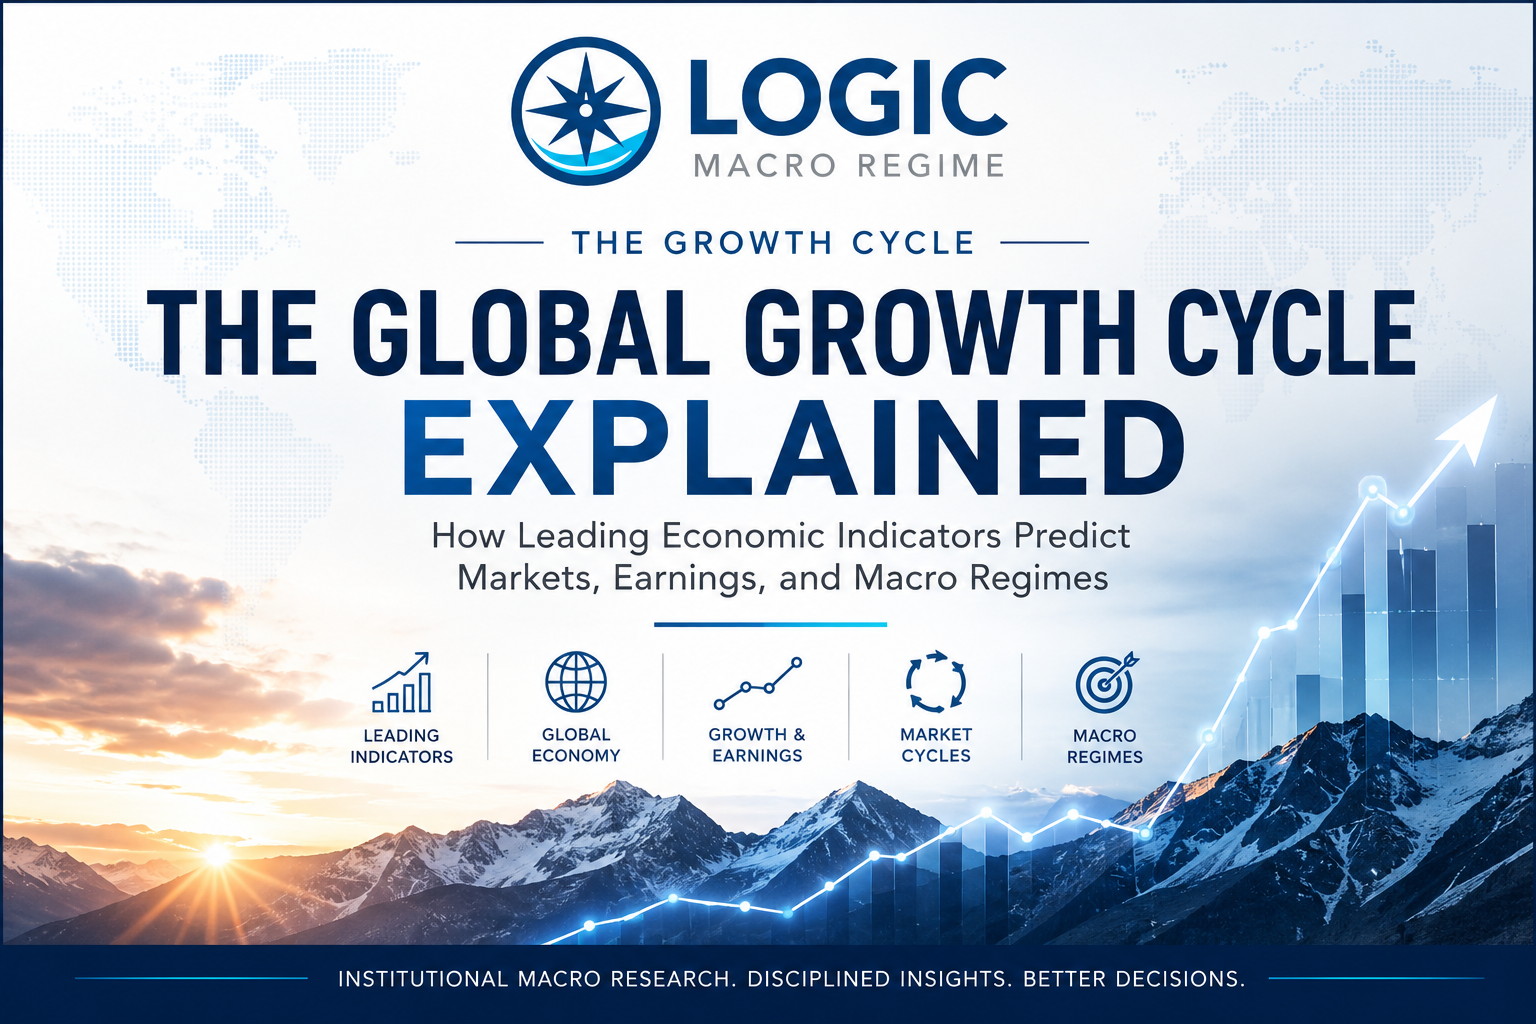
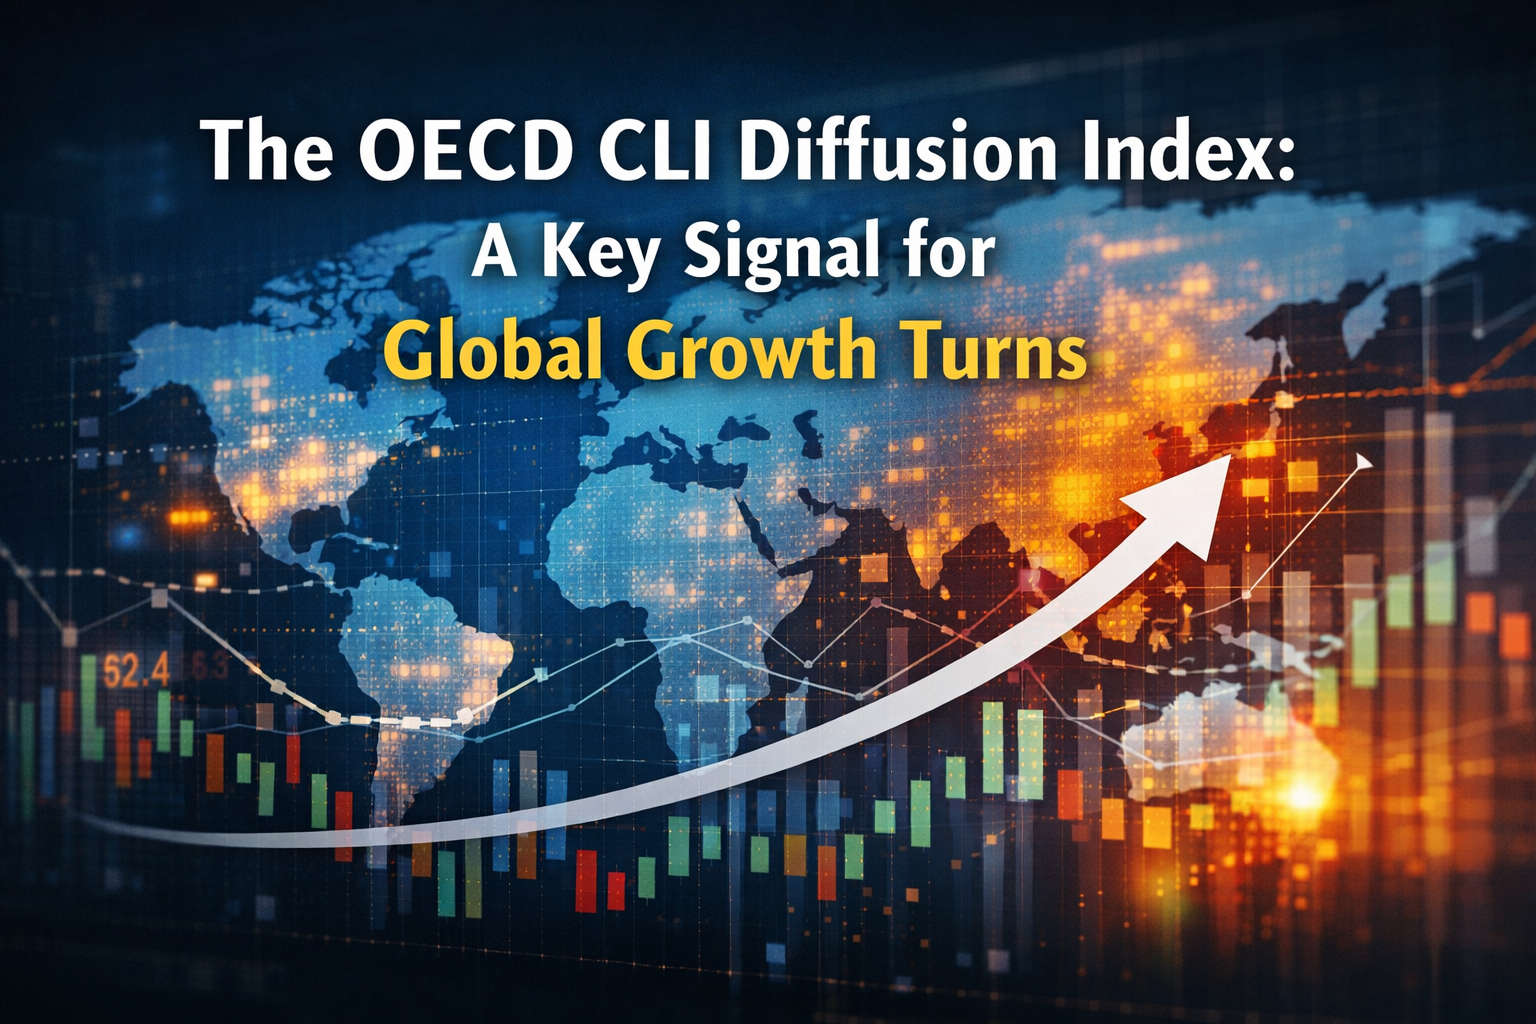
G - Growth: Instead of lagging GDP, we focus on Leading Growth Indicators like OECD CLI Diffusion. Diffusion measures the breadth of growth- is the economy improving across many countries and sectors, or is it being propped up by a single outlier? We also integrate PMIs and business cycle momentum to identify the direction of travel for growth.
I - Inflation: We analyze Forward Inflation Dynamics and persistence. This involves looking at PPI (Producer Price Index), inflation expectations, and the "stickiness" of prices. Identifying the regime - whether it is disinflationary growth, stagflation, or deflation - is the single most important factor in determining asset allocation.
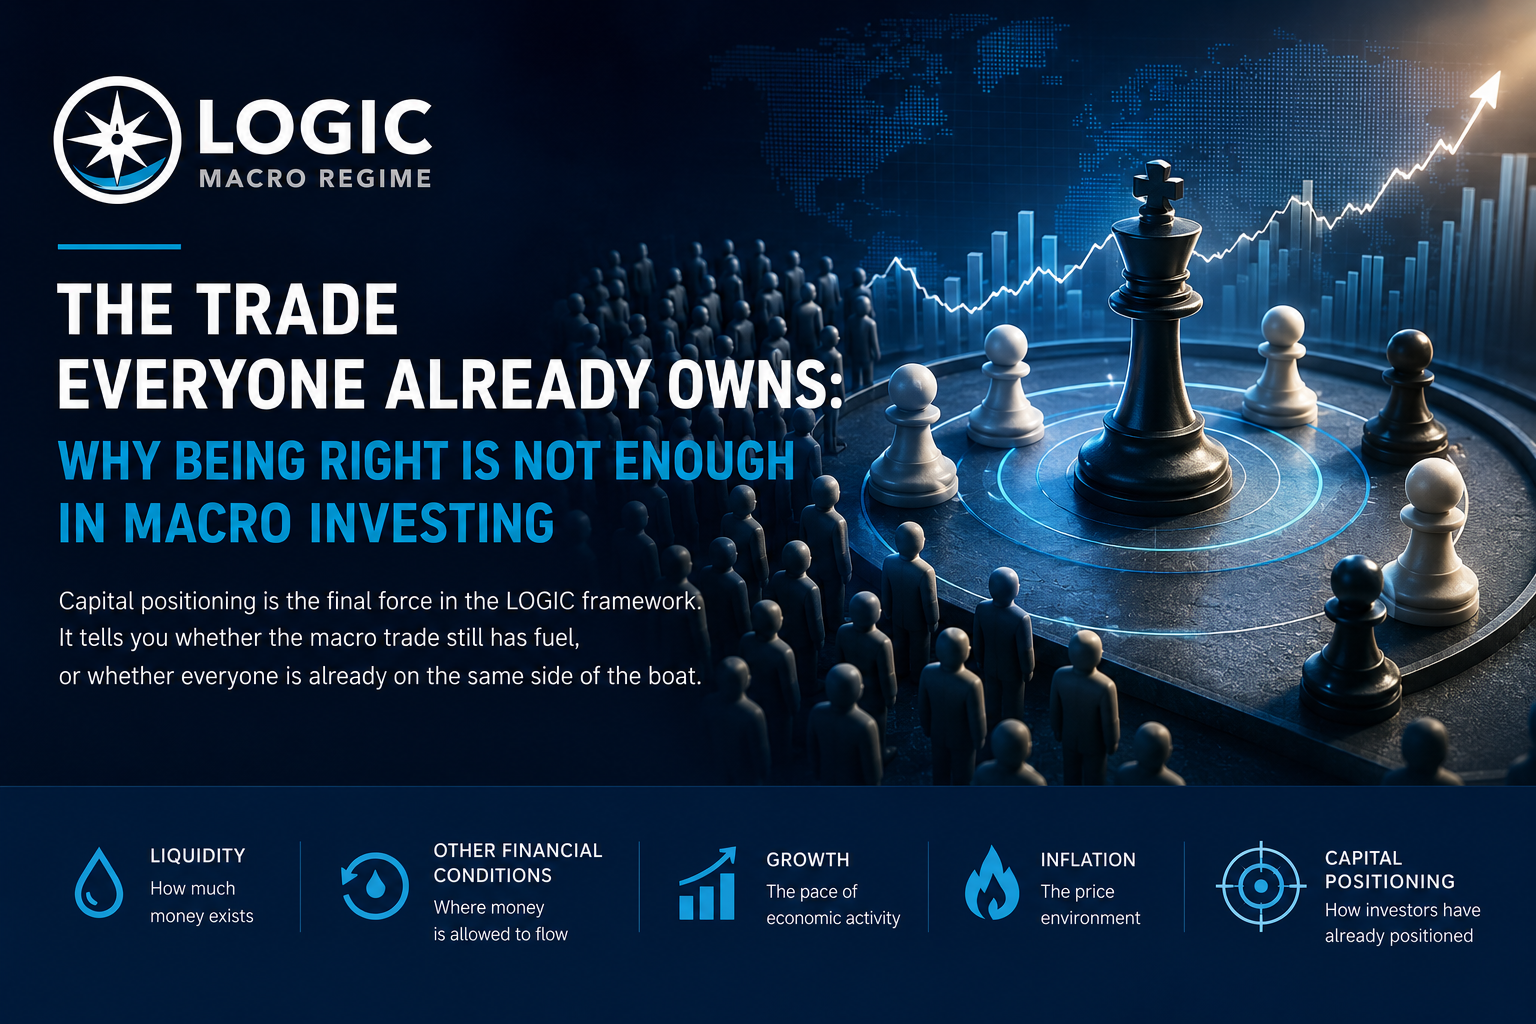
C - Capital Positioning: A macro thesis is only as good as the market’s ability to act on it. This pillar monitors Investor Positioning and Risk Appetite. If the macro data suggests growth is slowing, but every hedge fund is already "short," the market may rally on even more bad news because the "pain trade" is to the upside. We look for Cross-Asset Confirmation - do the bond, equity, and commodity markets agree on the narrative?
These five pillars provide a unified system. When Liquidity is rising, Financial Conditions are easing, and Growth is accelerating, you have a high-conviction "Goldilocks" regime. However, when Liquidity is falling while Inflation remains persistent (Stagflation), the investment roadmap changes entirely.
The Competitive Edge is Organization, Not Consumption
In an era where Artificial Intelligence can process millions of data points per second, the "information edge" has effectively vanished. Having the fastest news feed or the most complex spreadsheet no longer guarantees outperformance. In fact, the "Information Age" has created a new type of loser: the investor who mistakes "more information" for "better information."
The competitive advantage in modern macro investing belongs to the Expert Information Synthesizer. The most successful institutional firms, such as Bridgewater Associates or AQR, do not win by correctly guessing the next Non-farm Payroll number. They win by having a repeatable, disciplined process for organizing data into a coherent framework. They understand that the "macro regime" - the combination of growth, inflation, and liquidity - is what determines the long-term path of asset classes, sectors, and investment styles.
"The competitive advantage won’t come from consuming more information. It will come from organizing that information into a disciplined, repeatable decision-making framework."
When you organize information systematically, you stop reacting to the "narrative of the day." You start to see the connections between the China Credit Impulse and US manufacturing orders, or between real rates and the performance of long-duration growth stocks. You move from being a victim of market volatility to being a strategist who understands the underlying cycle.
Conclusion: From Data Points to a Roadmap
The transition from a reactive investor to a systematic one requires a fundamental shift in perspective. It requires the discipline to ignore the "breaking news" alert and instead ask: "How does this data point change the current macro regime? Does it shift the Risk Bias? Is it confirmed by other parts of the system?"
The objective of LOGIC Macro Regime is to provide that answer. By combining statistically tested leading indicators - from OECD CLI Diffusion to forward inflation dynamics - into a unified framework, we identify the direction of the macro cycle before it becomes a headline in the financial press. We focus on the "Risk Bias" and the historical asset classes that have performed best in similar environments, whether those are commodities in a stagflationary regime or defensive bonds in a deflationary bust.
Investors will always have access to more data. The noise will only get louder. The question is: Are you positioning your portfolio based on what just happened, or do you have a roadmap for where the cycle is heading next?
For those who are ready to move beyond the noise and adopt a more disciplined approach to the global markets, we invite you to explore LOGIC Macro Regime and our Monthly Macro Map to see how a unified framework can transform your investment process.