Ahoy!
This is a lagged sample of the October 2026 report, sent to paid subscribers at least a week before the reference month began. Paid subscribers also receive exclusive access to the interactive Monthly Macro Map dashboard, showing current conditions, the next six months, and how to position. The subscriber portal also includes the Back-Test Analyzer with 52 ETFs to compare across macro environments by return and risk.
October 2026 Snapshot
Forward View (6 months)
Since March, we’ve been preparing for a more challenging autumn. October’s return to Risk-On does not erase that concern. The November Risk-On Goldilocks window we’ve identified for some time could support a counter-rally, but our base case remains that the S&P 500 struggles to sustain a move above its August 13 high before weakness resumes. December and January then shift toward Risk-Off Goldilocks, followed by Risk-Off Deflation from February through April as growth and inflation decelerate together. That later environment could increasingly favor high-quality government bonds as inflation pressure eases. There may still be a rally to participate in, but the broader outlook argues against overstaying our welcome.
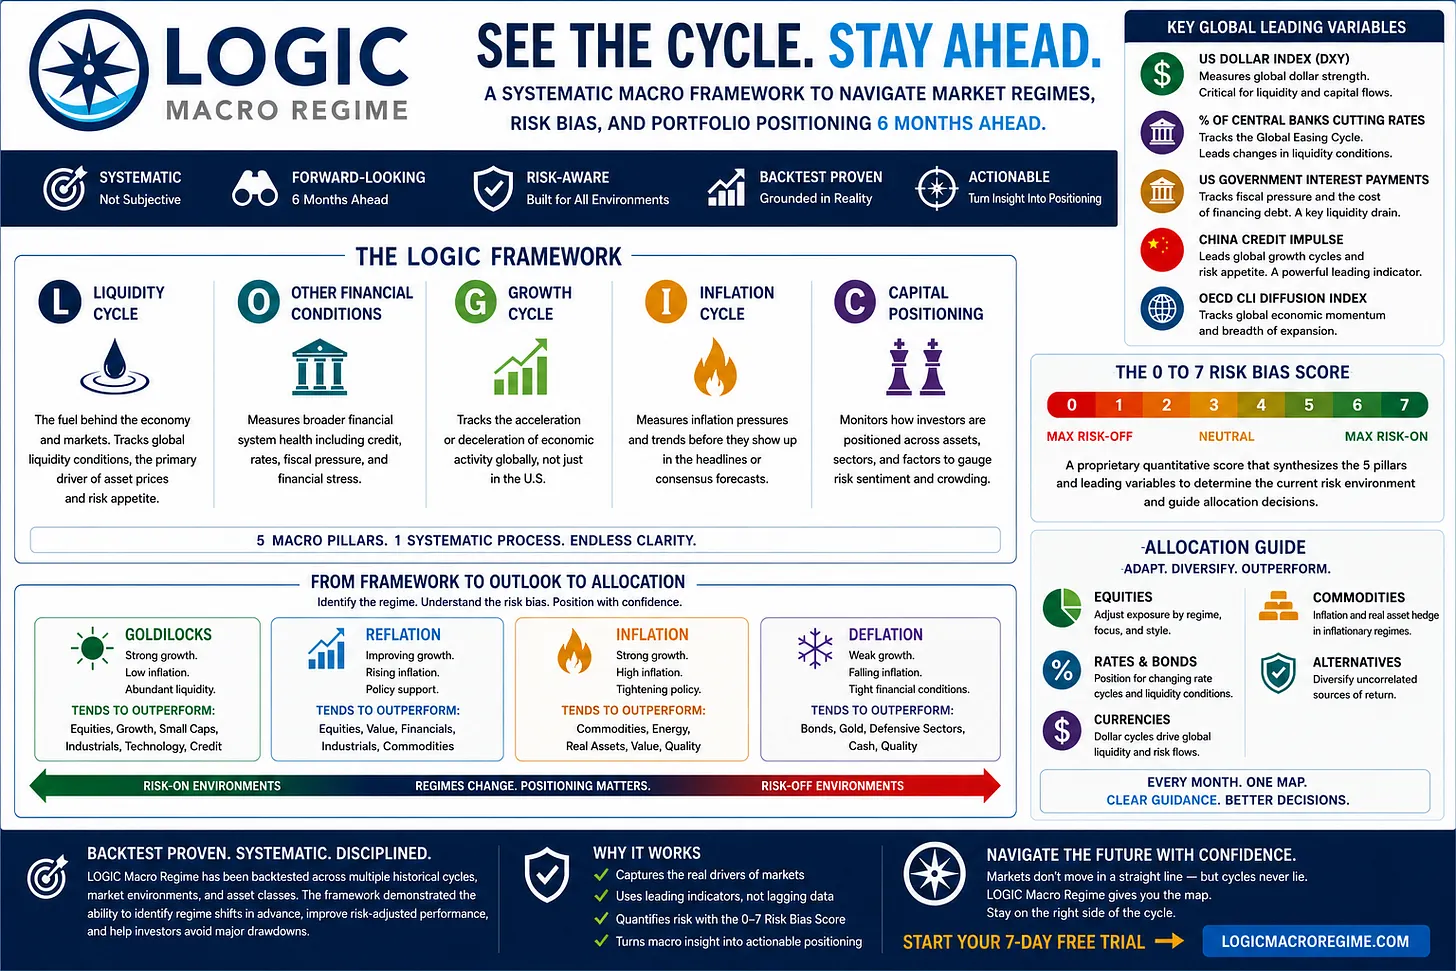
(L) Liquidity Cycle ✅
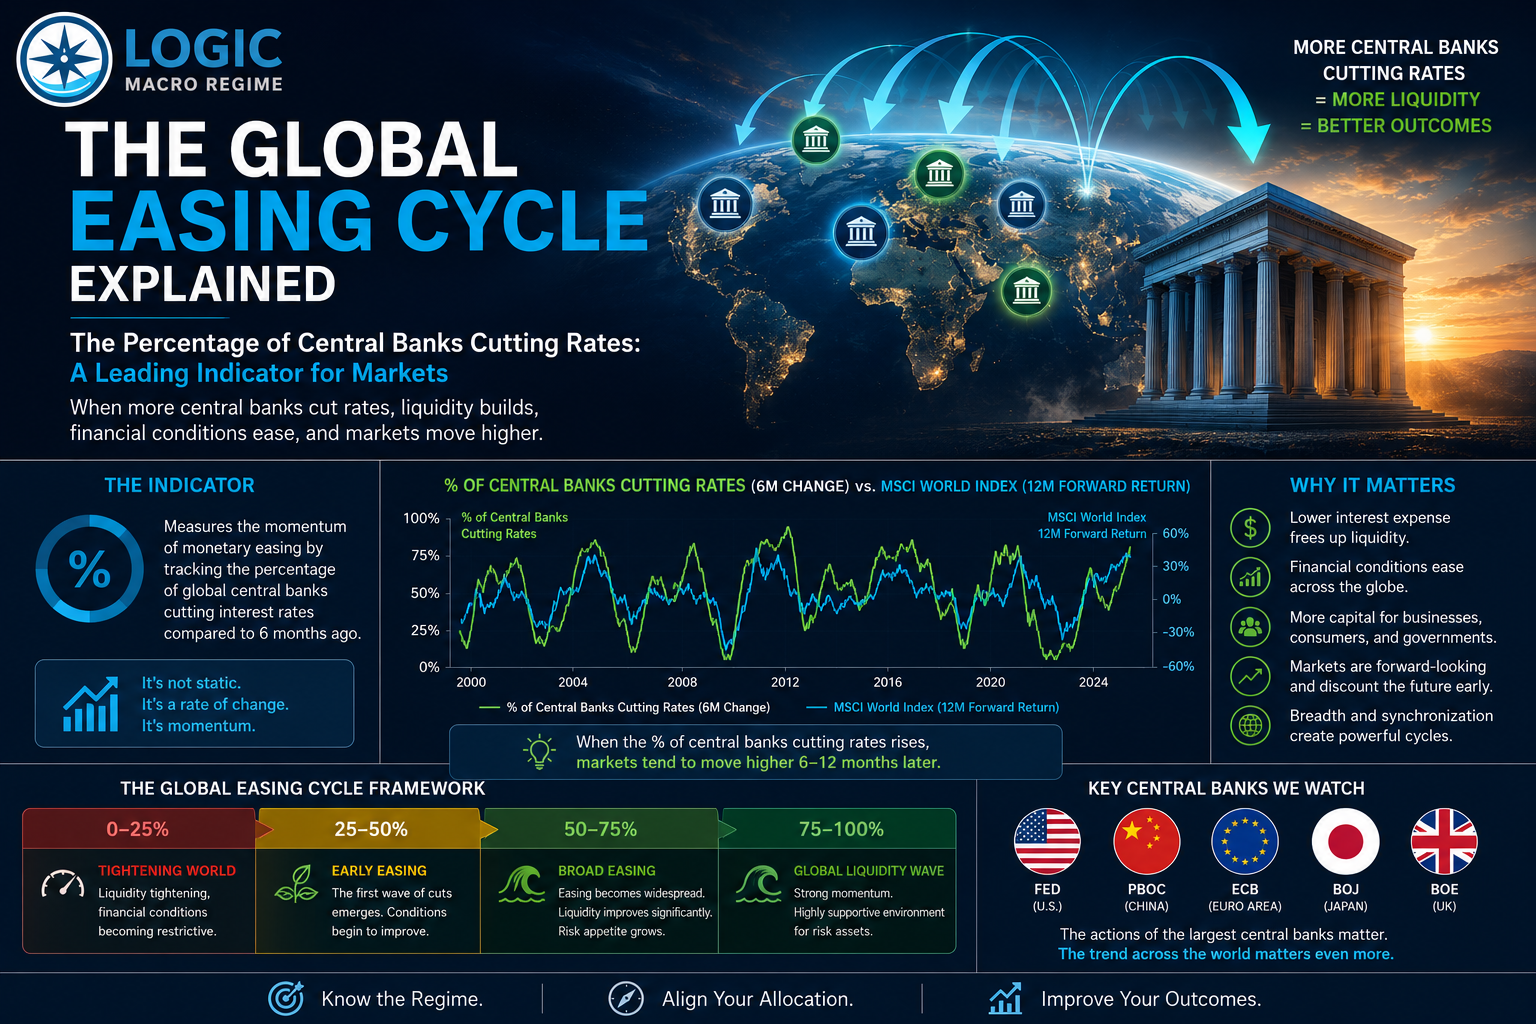
The Liquidity tide is still rising, but at a much slower pace. As we’ve discussed in previous updates, this support is increasingly running on fumes. Japan reported ¥15.4 trillion of currency intervention for July 30–August 26, illustrating the scale of recent efforts to stabilize currency markets. That intervention should not be confused with a fresh wave of global monetary stimulus. Our liquidity signal remains positive, but the cushion against weakness elsewhere is getting thinner.
(O) Other Financial Conditions ❌
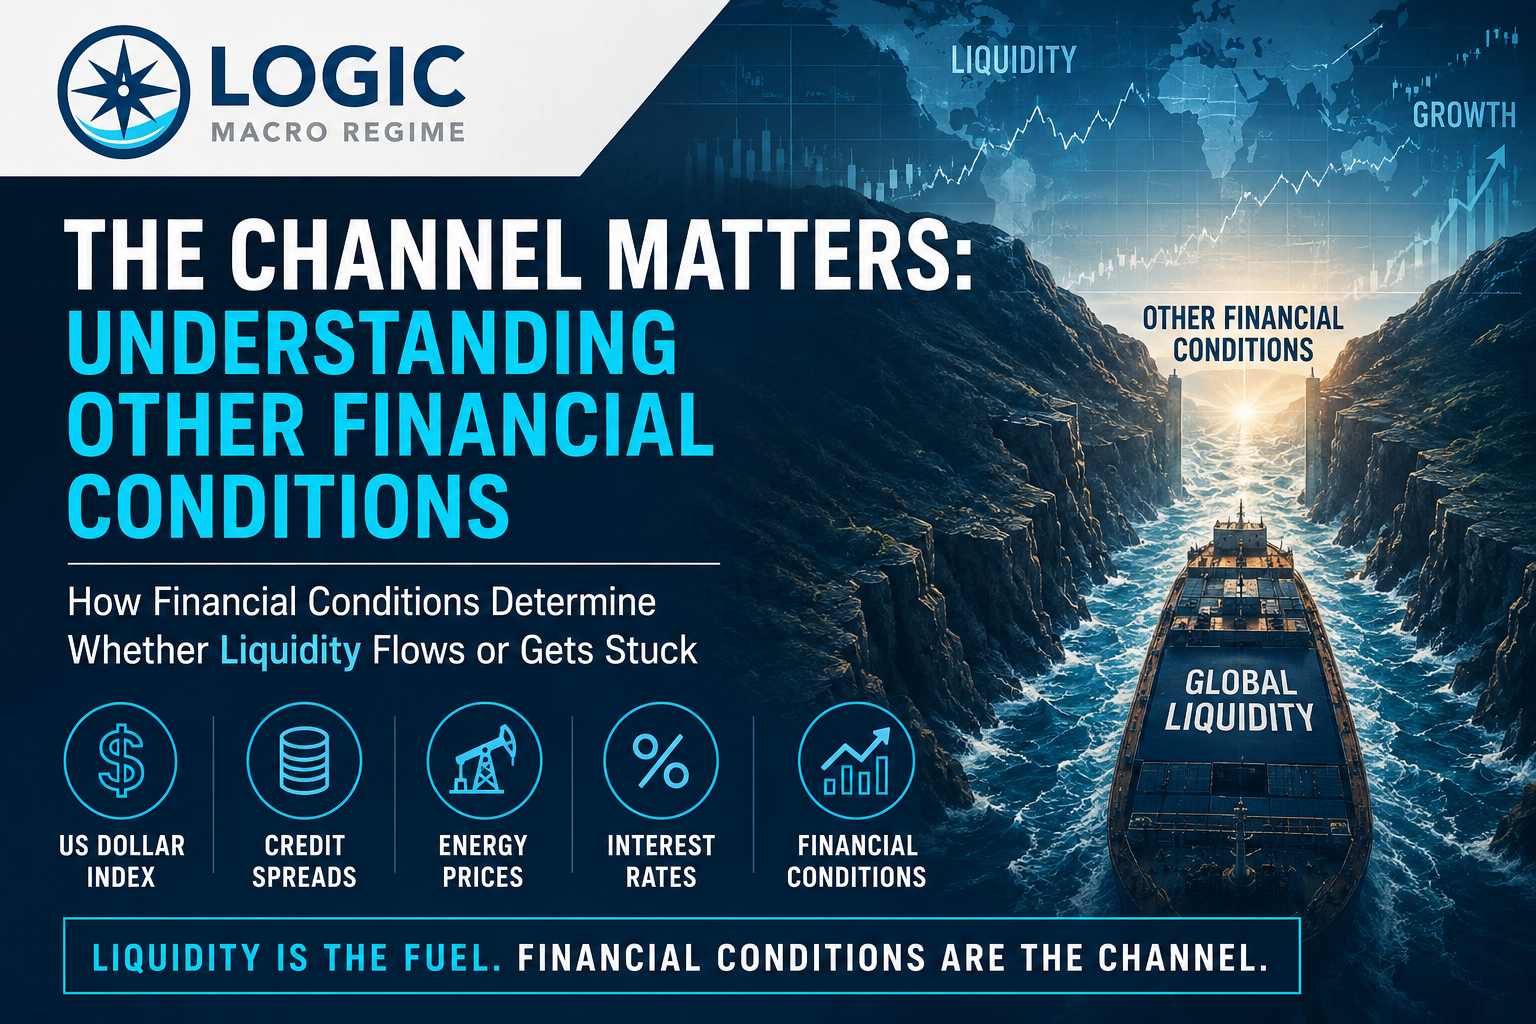
Other Financial Conditions have turned unfavorable. Pressure across the US Treasury curve and Japanese government bond market is raising the cost of capital when a highly indebted global economy can least afford it. Resultingly, the US Treasury announced a September 10 buyback of up to $6 billion per week in longer-dated securities, highlighting efforts to support market functioning. Buybacks, however, do not automatically translate into cheaper financing throughout the economy. Further, continued elevated crude oil prices remain a problem, keeping pressure on transportation and production costs while squeezing household purchasing power and business margins.
(G) Growth Cycle ⬇️
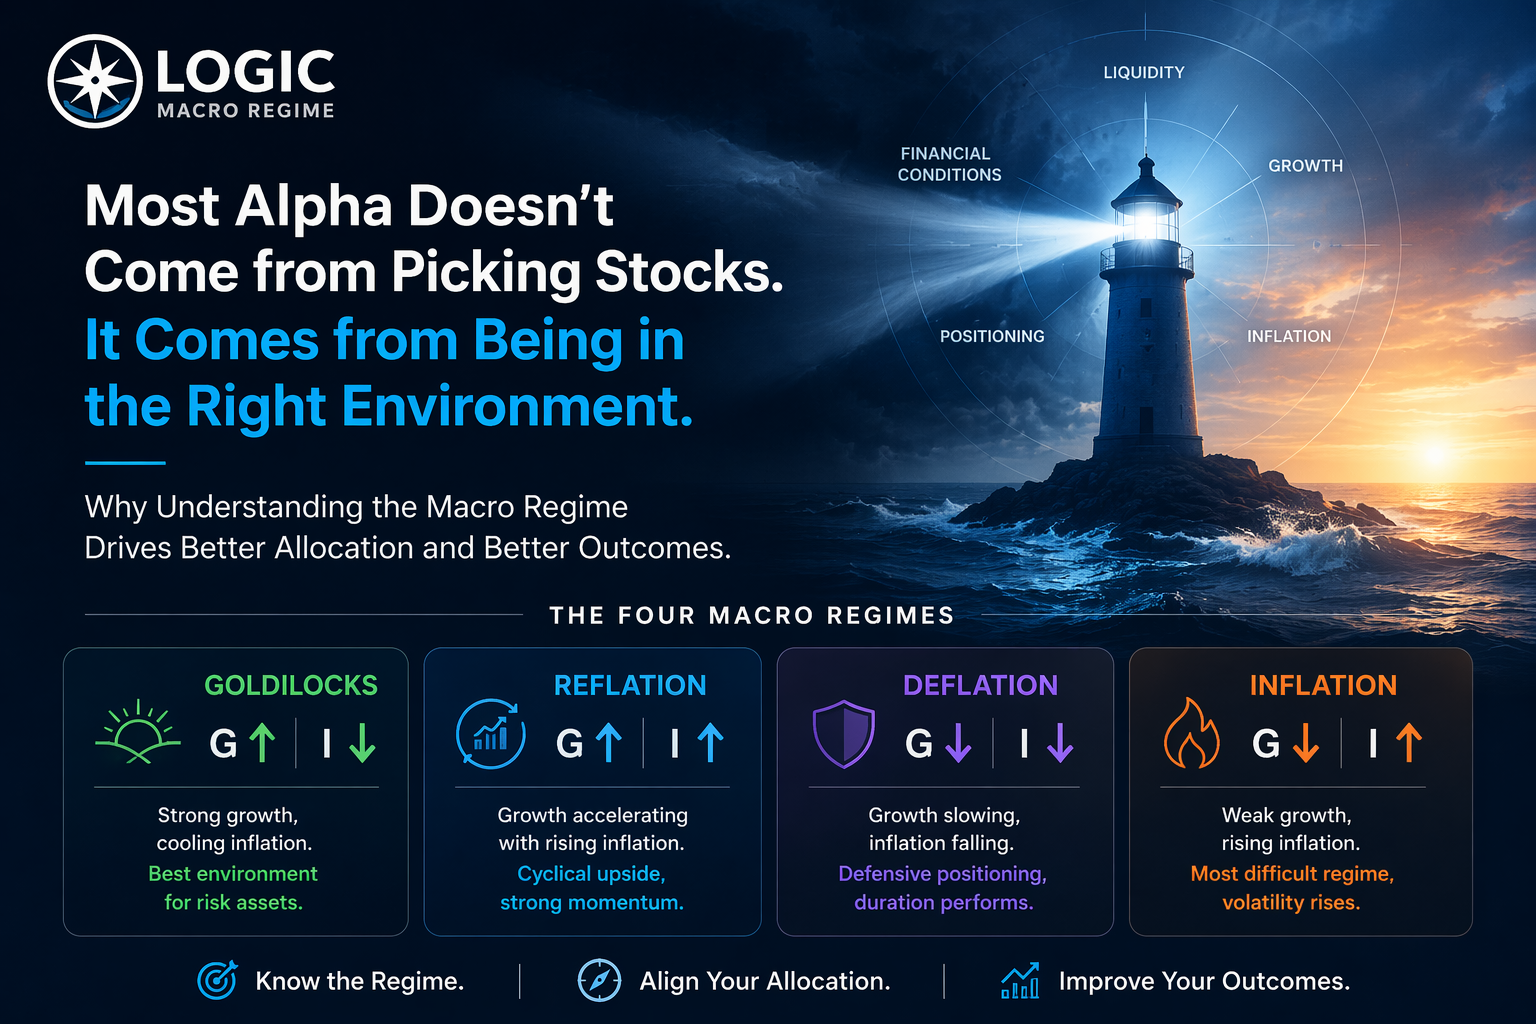
The Growth Cycle has now rolled over in our framework, confirming the loss of momentum we’ve been flagging. The concern is the direction of growth, rather than whether every economy is already contracting. Current economic releases remain mixed: August’s global composite PMI strengthened, even as manufacturing growth cooled in South Korea, Taiwan and India. Our leading indicators are signaling deterioration ahead; the broader activity data have not yet confirmed a synchronized global slowdown. We believe that becomes quite obvious in February to April as our macro regime forecast slips into decelerating growth, Deflation.
(I) Inflation Cycle ⬆️
Inflation remains sticky and temporarily accelerating in our framework. August US CPI rose 0.4% month-over-month, up from July’s 0.1%, leaving annual inflation at 3.4%. The near-term pressure has not disappeared. Further out, we still expect that pressure to ease as demand softens. November’s projected growth improvement allows a temporary Goldilocks phase as inflation cools. Later, renewed growth weakness alongside slowing inflation produces the Deflation regime appearing in our February–April outlook.
(C) Capital Positioning ✅
Capital Positioning has flipped back to positive, helping lift the score to 4 despite deterioration elsewhere. Bitcoin’s September 18 recovery above $80,000 is one visible example of investors’ continued willingness to take risk. Our interpretation is that some capital is positioning for a year-end rally. That can support prices temporarily, particularly around November’s improvement. But with the broader outlook still weak, we expect this renewed enthusiasm to struggle for staying power. Positive positioning alone cannot repair deteriorating growth and financing conditions.
Positioning Implications
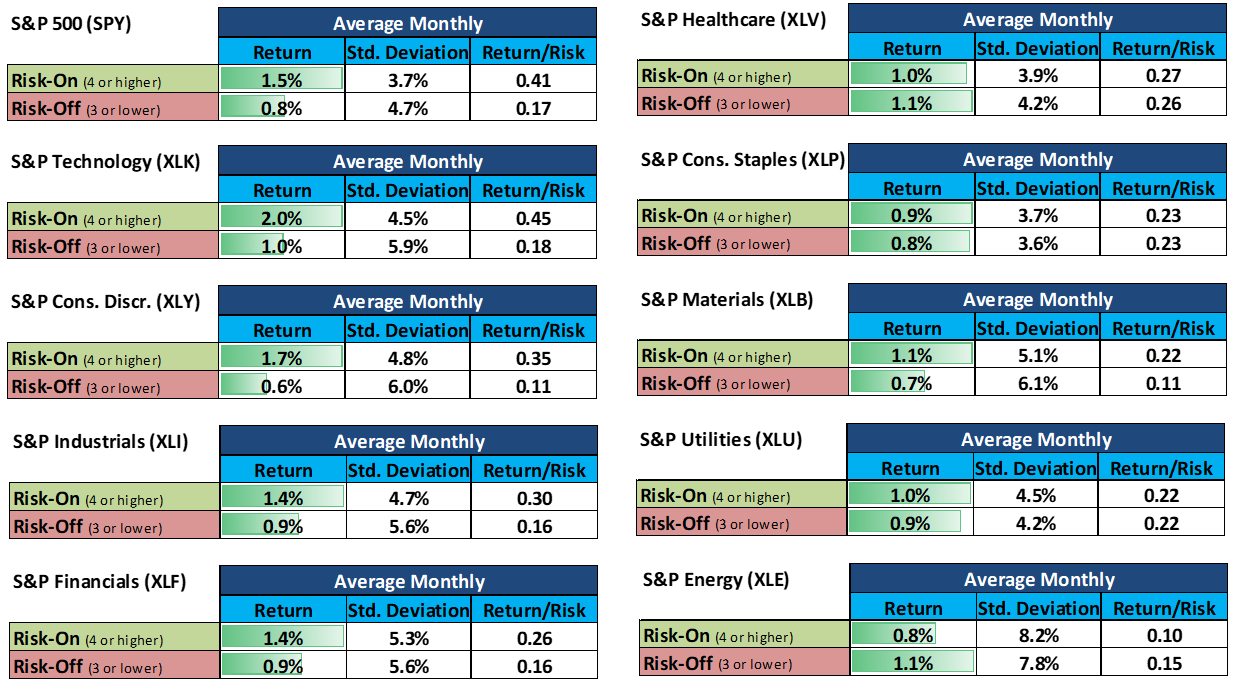
Given the outlook for the next six months, our framework and historical back-test results favor positioning toward the following assets:
- Asset classes: Overweight bonds (BND) and cash (PMMF); underweight stocks (VT) and broad commodities (DBC).
- Currencies: US dollar (UUP) and Swiss franc (FXF).
- Fixed income: High-yield credit (HYG), leveraged loans (BKLN), long-term Treasuries (TLT), investment-grade credit (LQD) and convertible bonds (CWB).
- Equities: Industrials (XLI), energy (XLE), high-dividend yield (VYM), financials (XLF) and utilities (XLU).
- Commodities: Silver (SLV), Bitcoin (IBIT) and Gold (GLD).
These selections identify relative strengths within each asset class, so favoring particular equities or commodities remains consistent with holding less of those categories overall.
Stay Systematic.