
US real GDP just grew 3.4% annualized in the third quarter. Broad money supply is expanding at 5.7% year-over-year. At first glance, that looks like a remarkably constructive backdrop for investors.
Yet our forward macro assessment is becoming more defensive. The question is not whether the economy is still growing. It is whether the conditions sustaining that growth are beginning to lose momentum.
Here are five important signals behind the headline data, and what we believe investors should watch next.
1. M2 Is Rising While the Monetary Base Is Falling
According to the Federal Reserve’s October 27 H.6 release, US M2 reached $23.4 trillion in September, up approximately 5.7% from a year earlier. The monetary base, meanwhile, stood near $5.5 trillion, down approximately 0.5% year-over-year.
These aggregates measure different things.
M2 captures deposits and other highly liquid private-sector balances; the monetary base consists of currency and reserves held at the Federal Reserve. Bank deposits can grow even when reserve balances decline. There is no fixed multiplier connecting the two.
The divergence does not, by itself, signal a credit crunch. But it highlights why money supply should never be treated as a single, all-encompassing measure of investable liquidity.
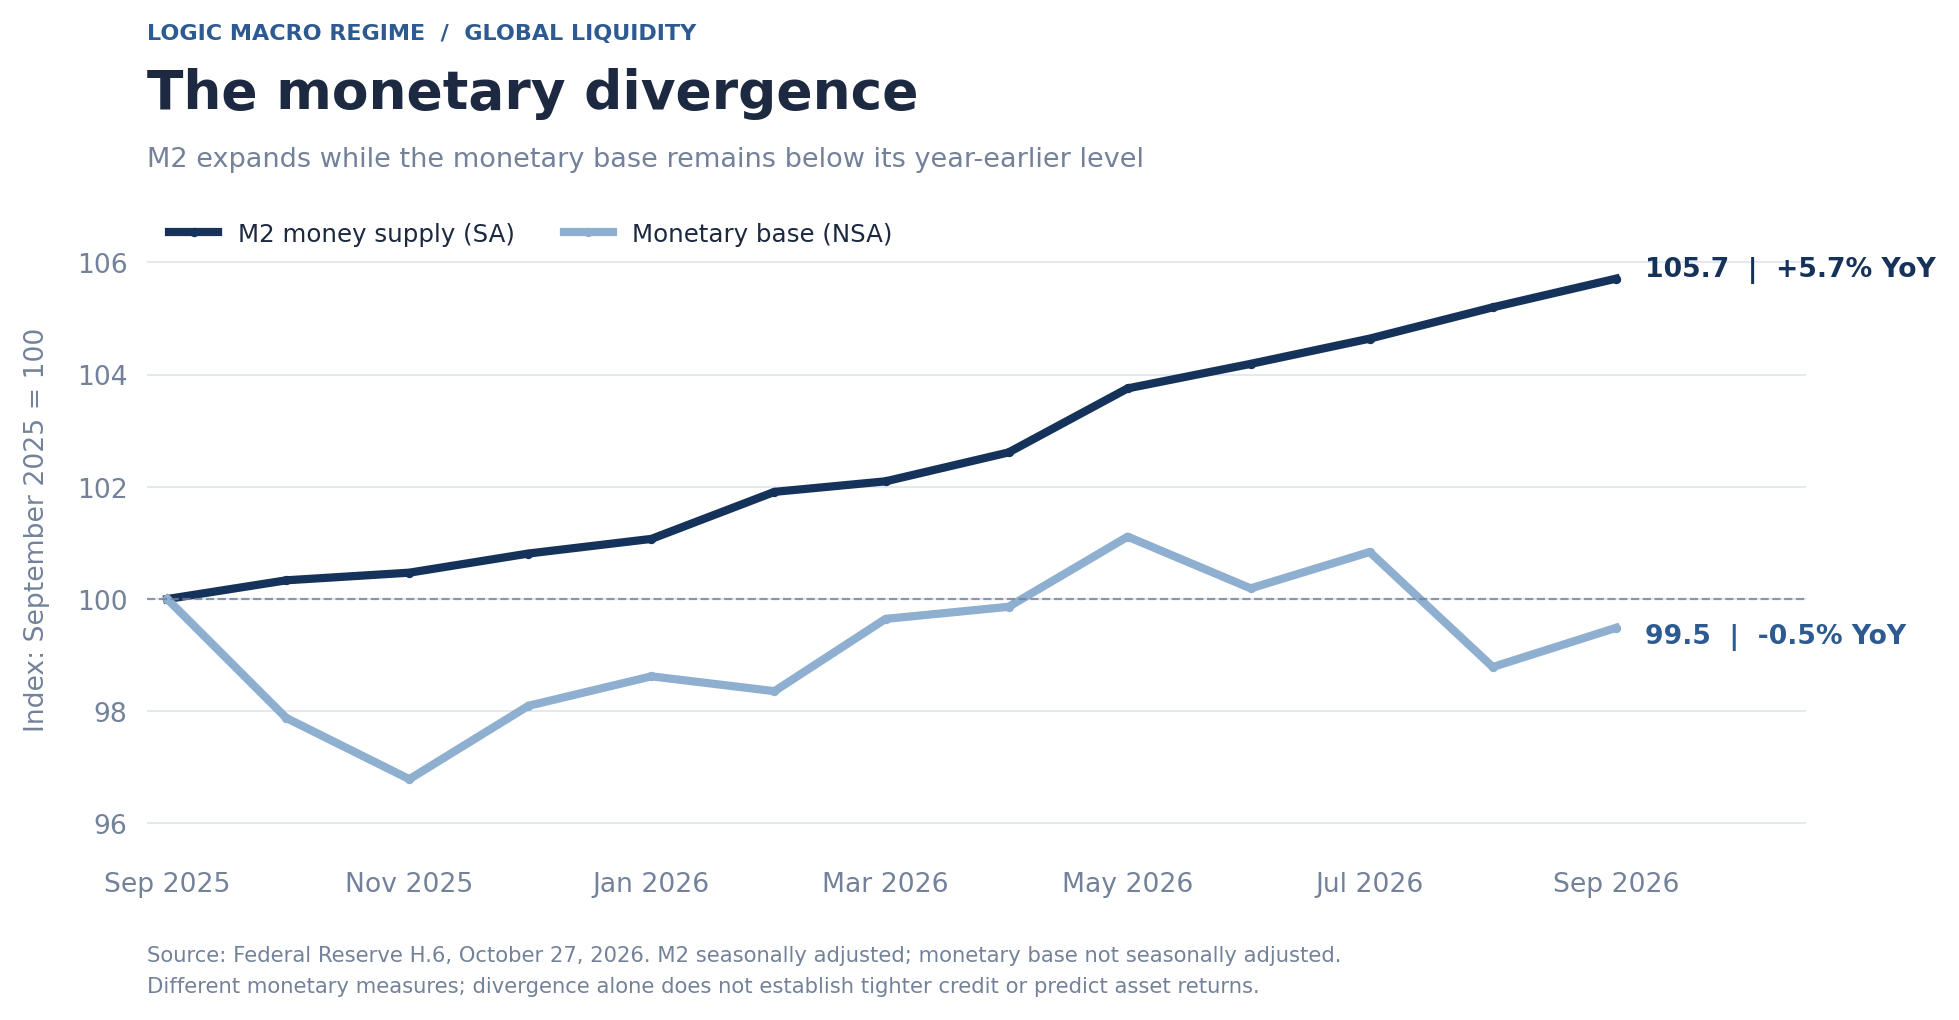
Chart 1. M2 is expanding while the monetary base remains below its year-earlier level. Source: Federal Reserve H.6.
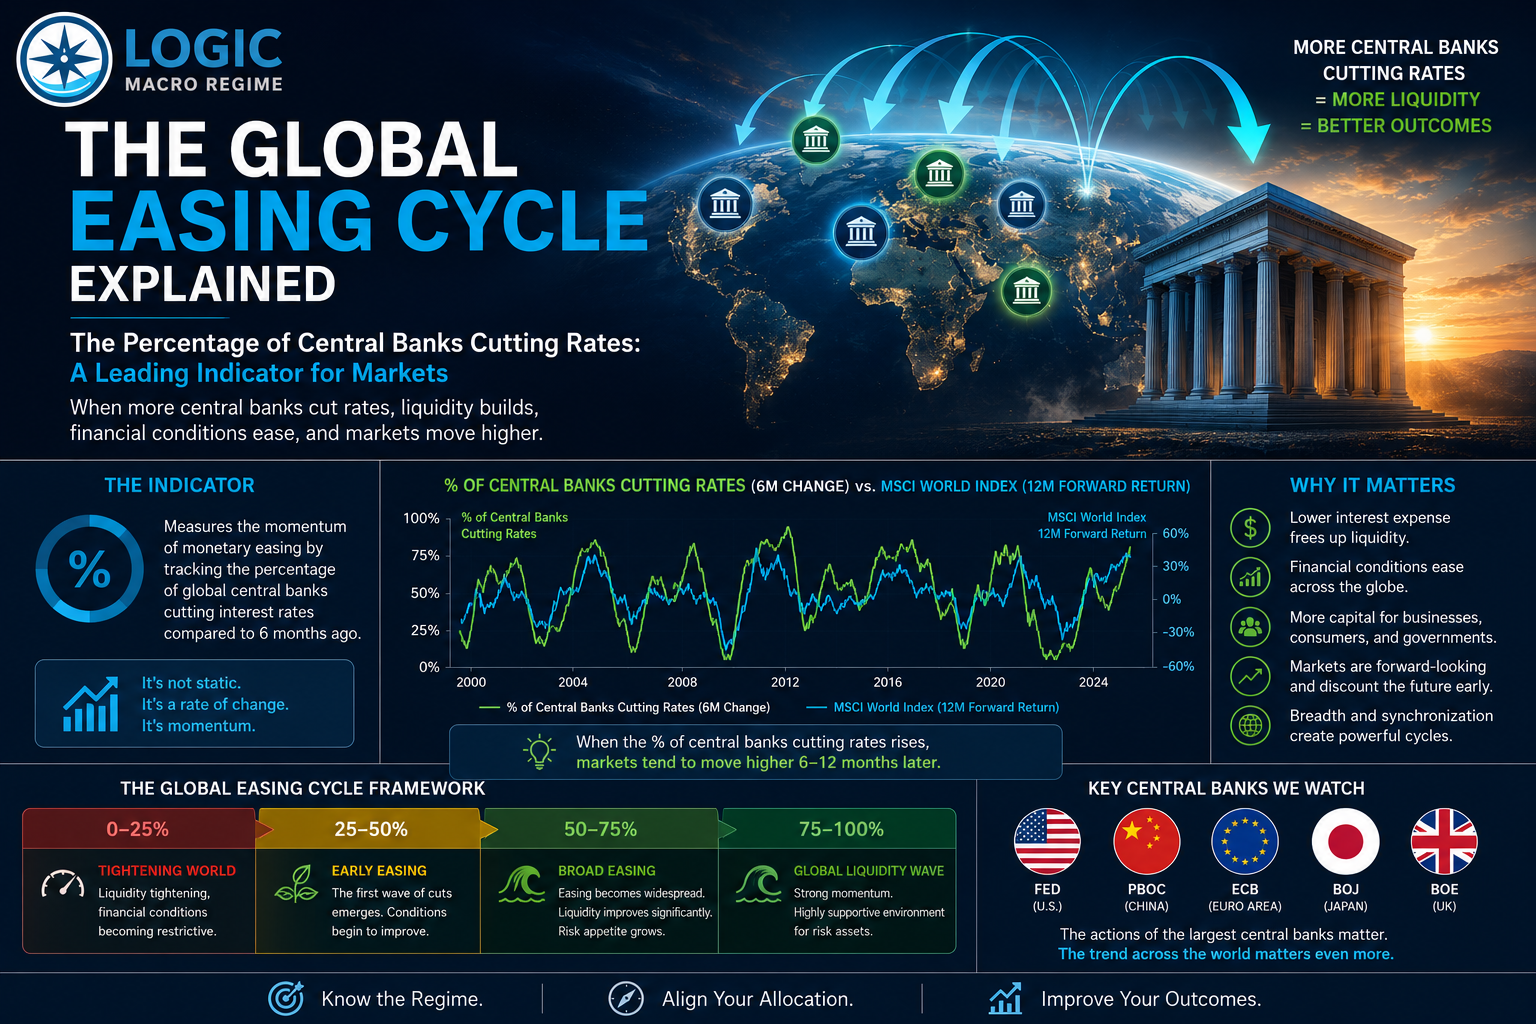
As explored in The Global Liquidity Cycle Explained, liquidity is the fuel, but the direction and transmission of that fuel matter as much as its quantity. Our Liquidity Cycle remains positive, yet its forward momentum is fading.
2. The Monetary Plumbing Can Work Against the Headline
The distinction becomes clearer inside the Federal Reserve’s balance sheet. Between October 14 and October 21, the Treasury General Account rose approximately $59.3 billion, while bank reserve balances fell roughly $61.3 billion, measured using Wednesday balances in the H.4.1 releases.
That is a one-week snapshot, not evidence of a persistent contraction. Many balance-sheet factors affect reserves, and Treasury cash transfers do not automatically reduce M2. Still, it illustrates how funds moving between the banking system and Treasury can change the short-term liquidity backdrop.
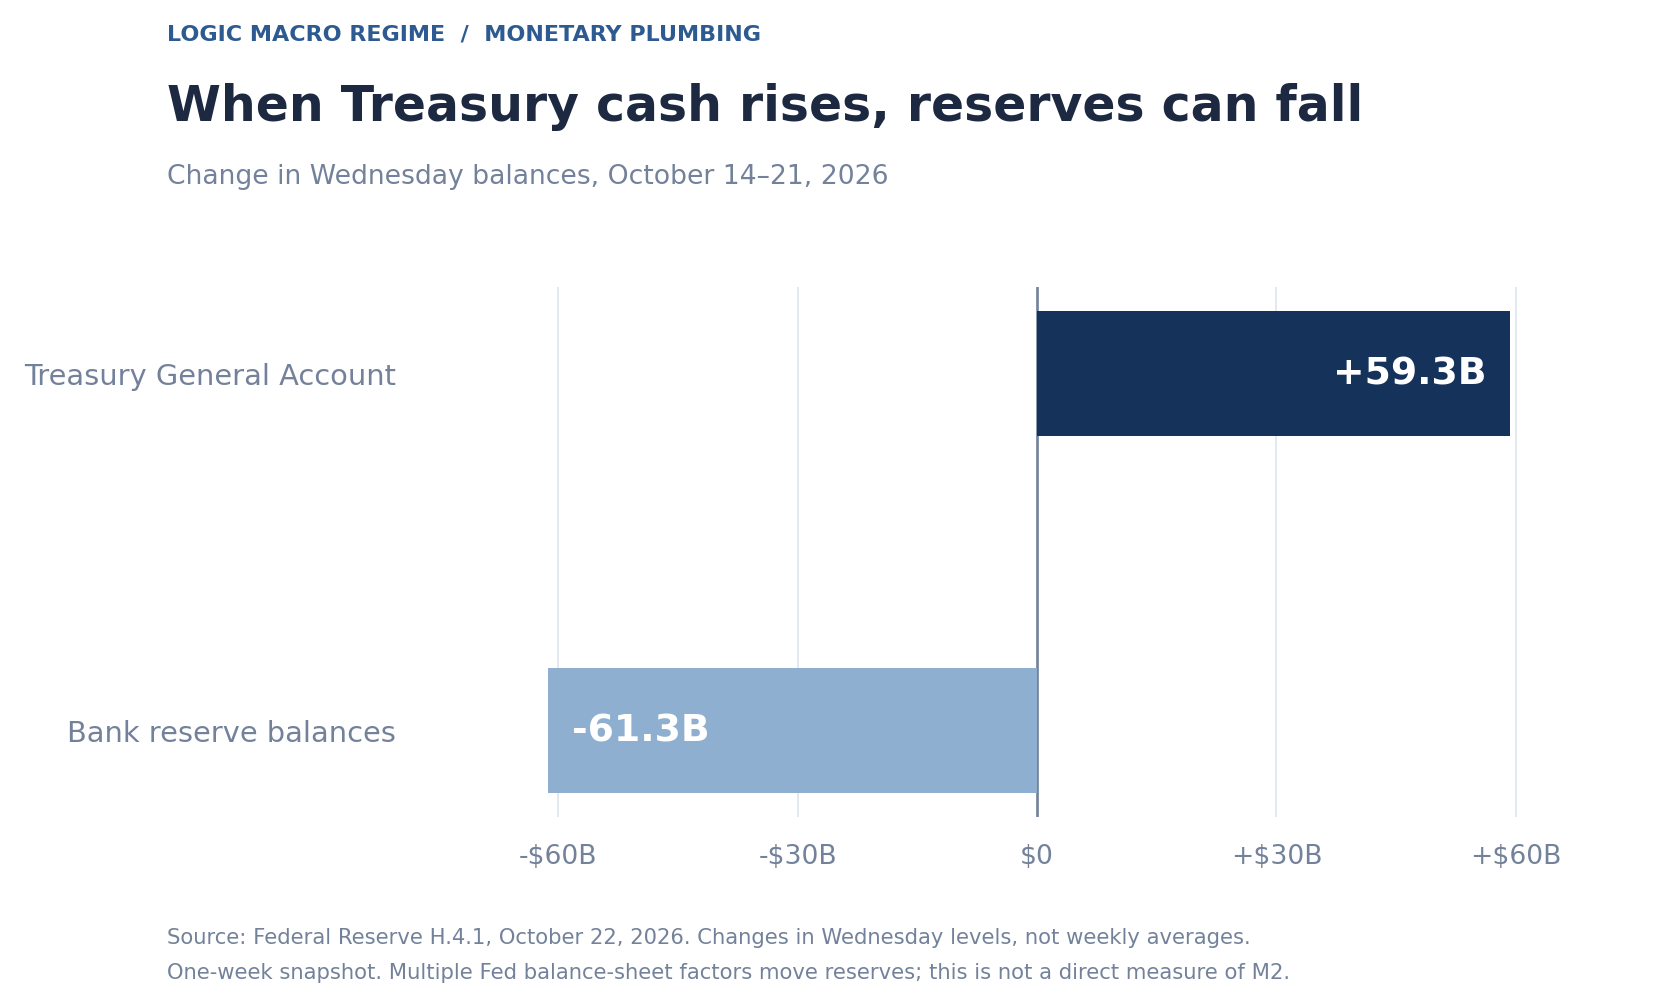
Chart 2. Treasury cash accumulation coincided with a decline in reserve balances. Source: Federal Reserve H.4.1; Wednesday-to-Wednesday changes.
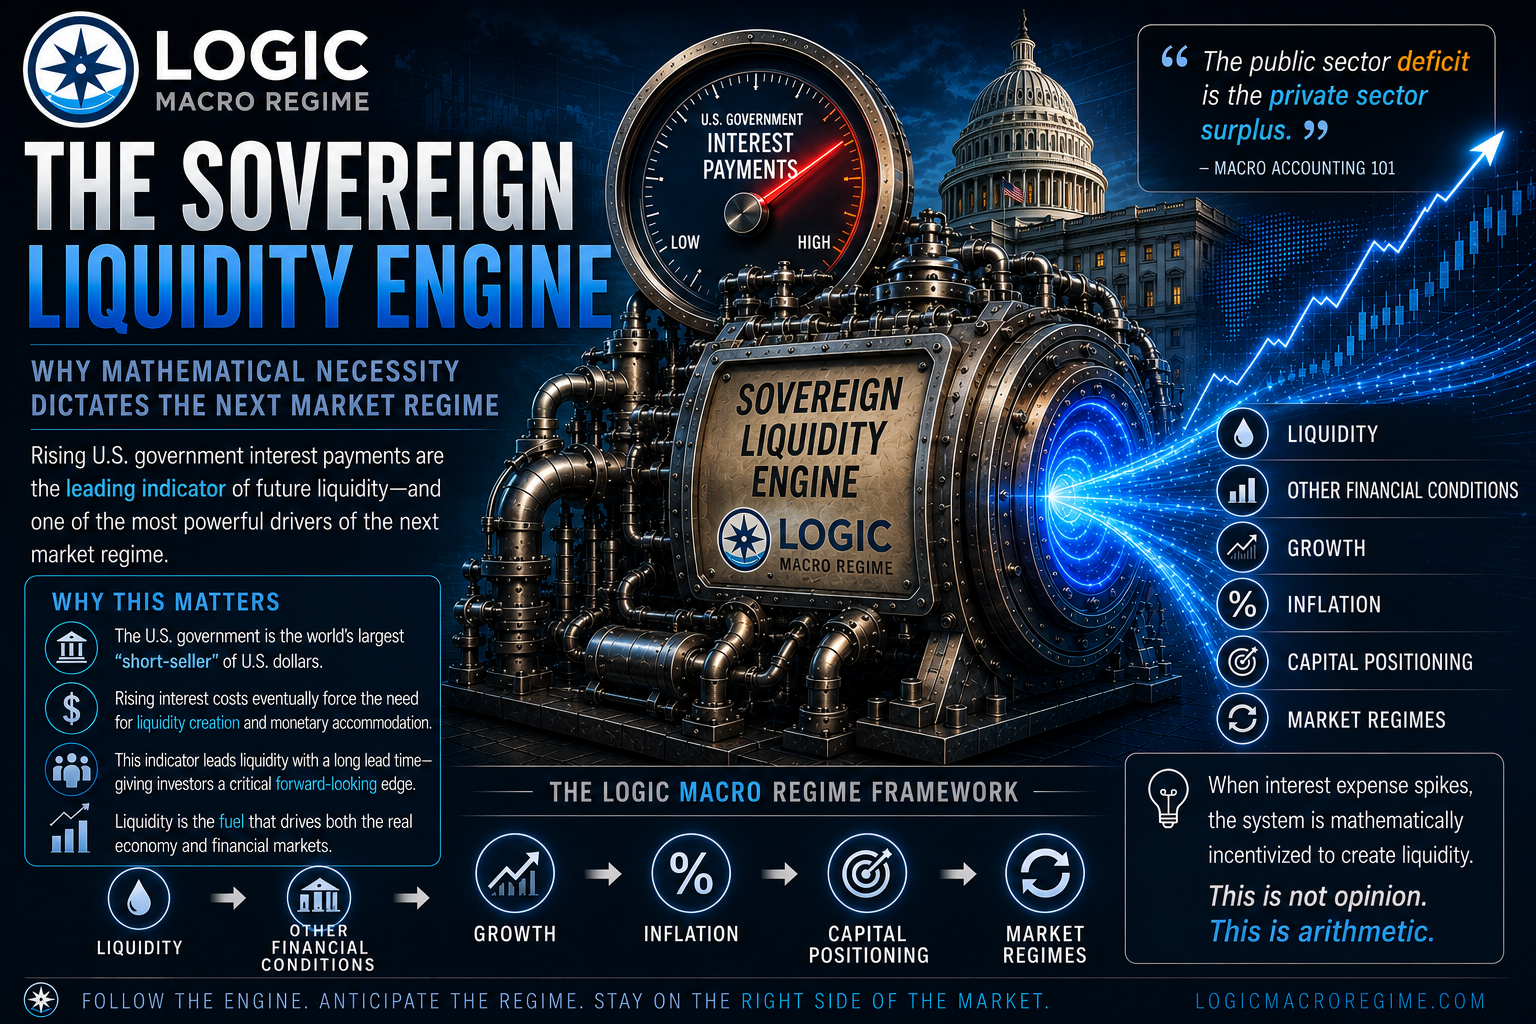
Then comes the transmission channel. Elevated long-term yields raise financing costs. A firm dollar can tighten global dollar funding. Widening credit spreads can signal greater reluctance to take risk, while elevated oil prices squeeze purchasing power and margins.
That is why we distinguish Liquidity from Other Financial Conditions. More money does not automatically mean easier conditions for markets.
3. Strong GDP Can Coexist With Weakening Growth Breadth
The latest GDP report shows US growth accelerating from 2.2% in Q2 to 3.4% in Q3. That strength is real, and should not be dismissed.
But September’s income and spending release was more uneven: real disposable income declined 0.3% month-over-month, real consumption was essentially flat, and annual PCE inflation reached 3.6%. One soft month does not undo a strong quarter, but it complicates the picture.
Our proprietary Growth Cycle has turned negative, driven in part by weakening breadth across the global economy. We watch not only how fast major economies are growing, but how many are accelerating at the same time.
This is the principle behind our OECD CLI Diffusion Index and Global Growth Cycle framework. Headline GDP describes a completed quarter; leading growth breadth helps us assess what may come next.
4. The LOGIC Edge: Better Allocation Decisions, Better Risk-Adjusted Returns
Knowing the macro regime is useful. Knowing how to allocate around it is where LOGIC seeks to create an edge.
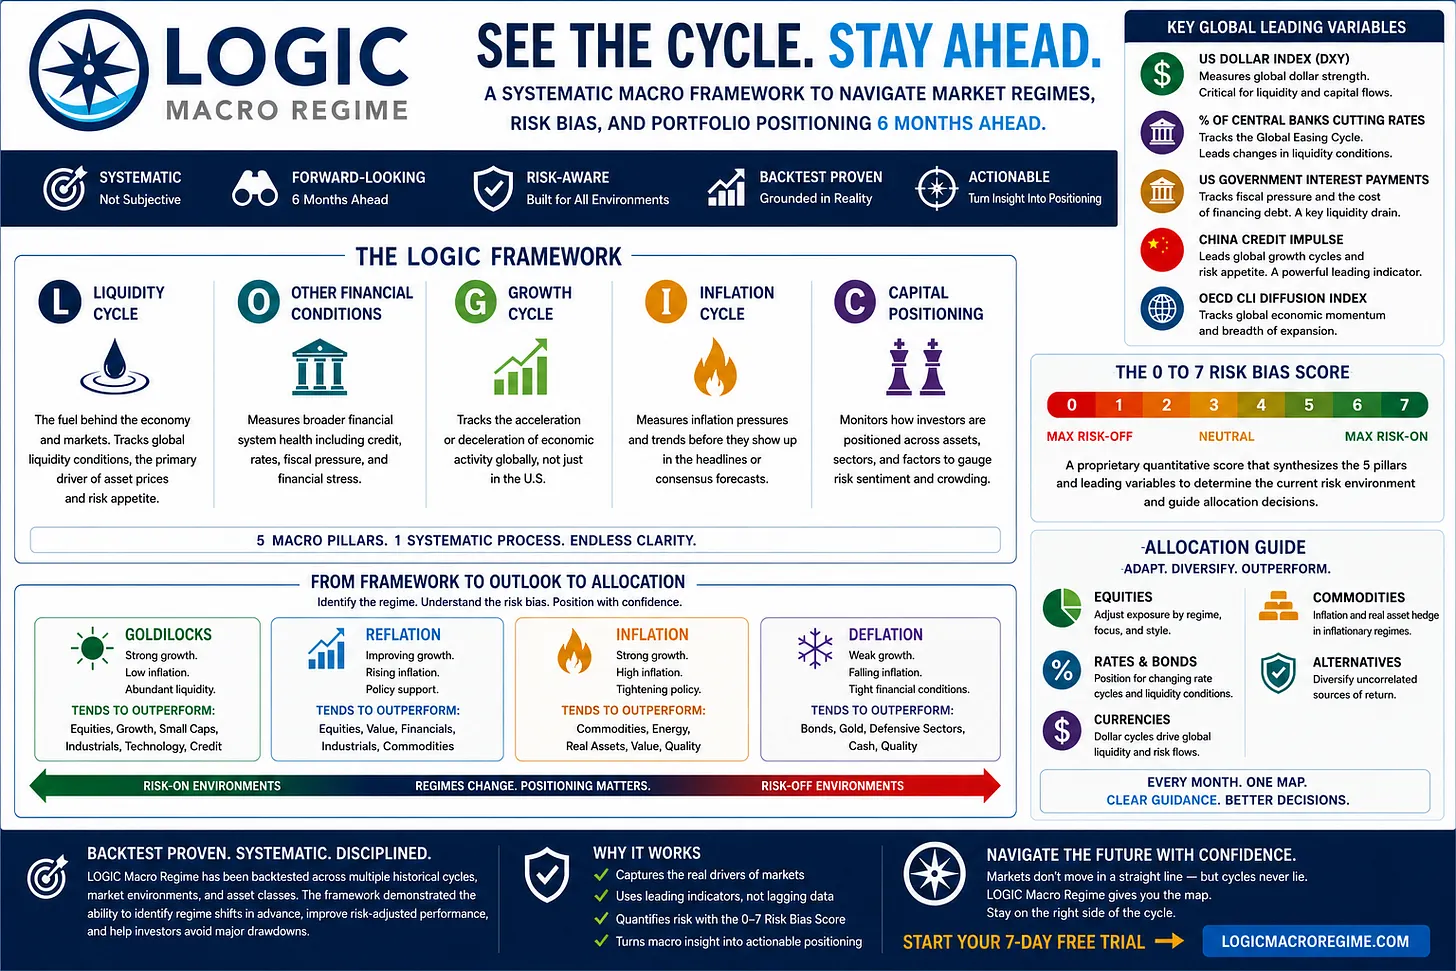
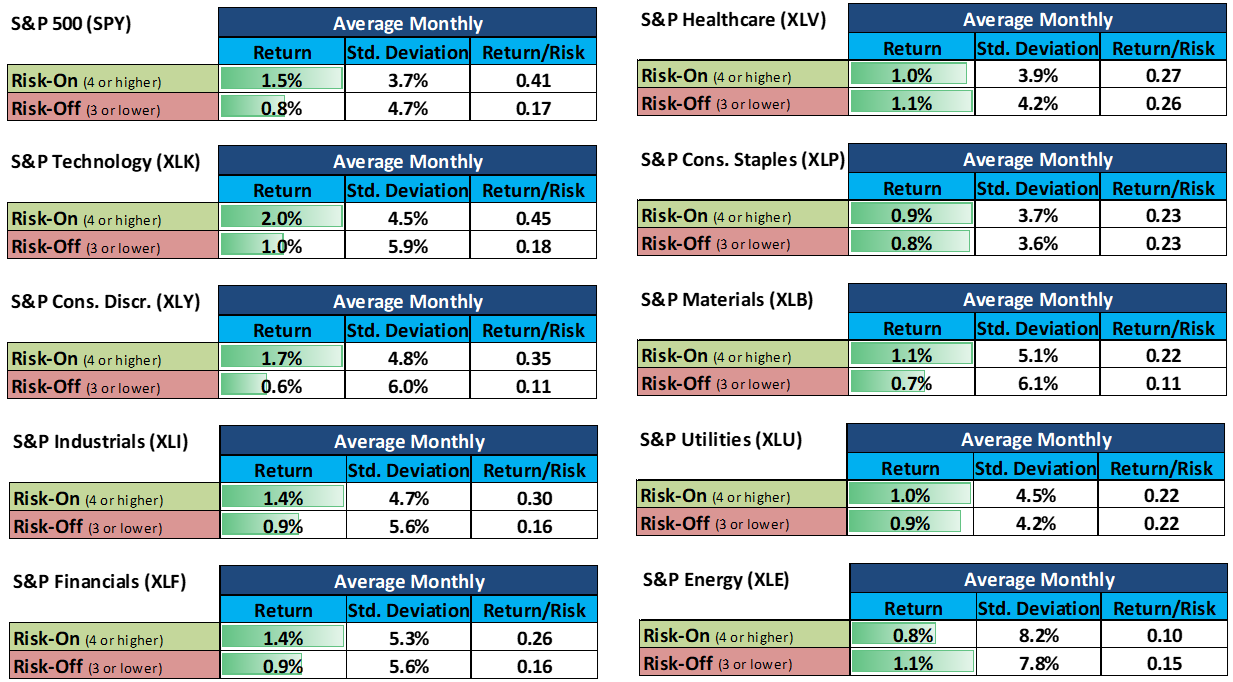
The framework combines two decisions. First, the 0–7 Risk Bias Score guides how much risk to take, favoring greater risk exposure in Risk-On conditions and a more defensive mix in Risk-Off environments. Second, the Macro Regime helps identify historically stronger investments, sectors and style exposures across currencies, fixed income, equities and commodities. The result is a systematic allocation process instead of a portfolio that stays static through every cycle.
The historical comparison demonstrates the potential. In a hypothetical walk-forward test covering 169 completed months from September 2012 through September 2026, LOGIC produced 12.80% annualized returns versus 5.90% for a fixed-allocation baseline. Its return-to-volatility ratio reached 1.16 versus 0.74, approximately 57% more return per unit of measured volatility. A starting $10,000 grew to $54,526 versus $22,415.
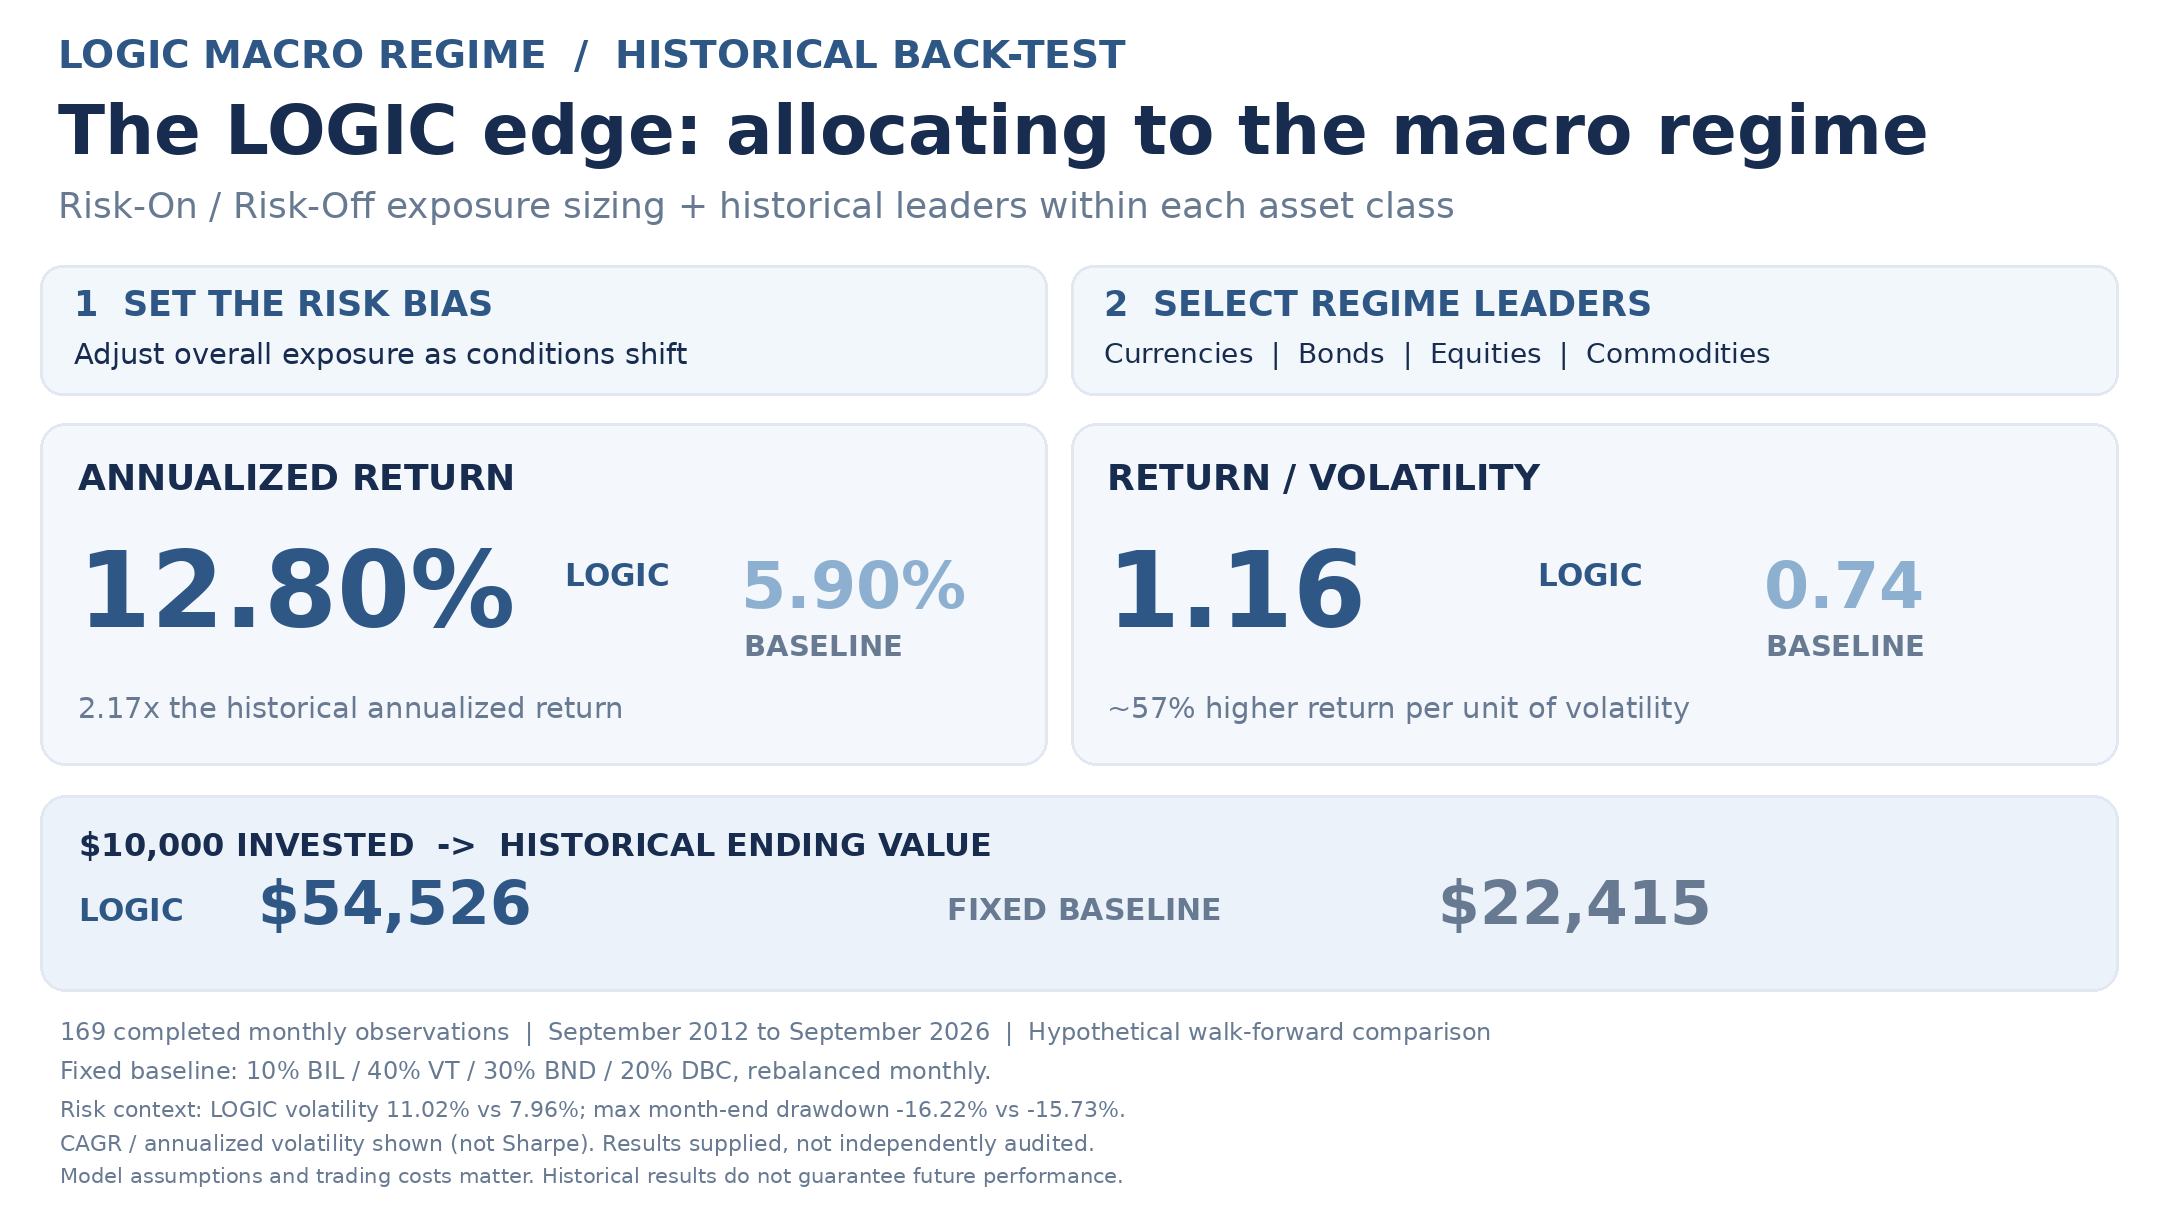
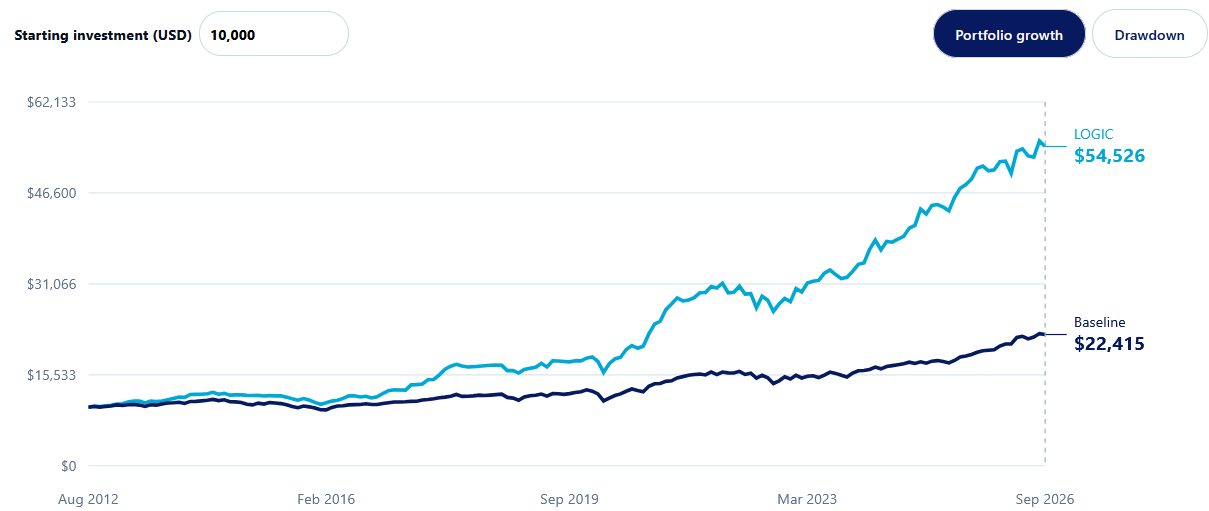
Chart 3. By combining Risk-On/Risk-Off allocation decisions with historically stronger regime-specific exposures, LOGIC delivered higher returns and a stronger return-to-volatility ratio in this hypothetical comparison. Explore the assumptions, asset selection and full results on the LOGIC Back-Test page.
The LOGIC strategy experienced higher absolute volatility and a slightly larger maximum month-end drawdown in this test. But critically, the additional volatility was accompanied by meaningfully higher historical return per unit of risk. That is the benefit LOGIC seeks to deliver: more disciplined allocation decisions, guided by the macro regime rather than the market narrative. Results are hypothetical, not independently audited, and cannot guarantee future outperformance. To understand how leadership rotates, see Returns Are Only Half the Story and Most Portfolios Aren’t Built for Risk-Off.
5. The Next Transition Could Be More Important Than Today’s GDP Print
Our current November assessment is Risk-On Inflation, but only by a narrow margin. The proprietary six-month path points toward Risk-Off Goldilocks in December and January, Risk-Off Deflation from February through April, and Risk-Off Goldilocks in May.
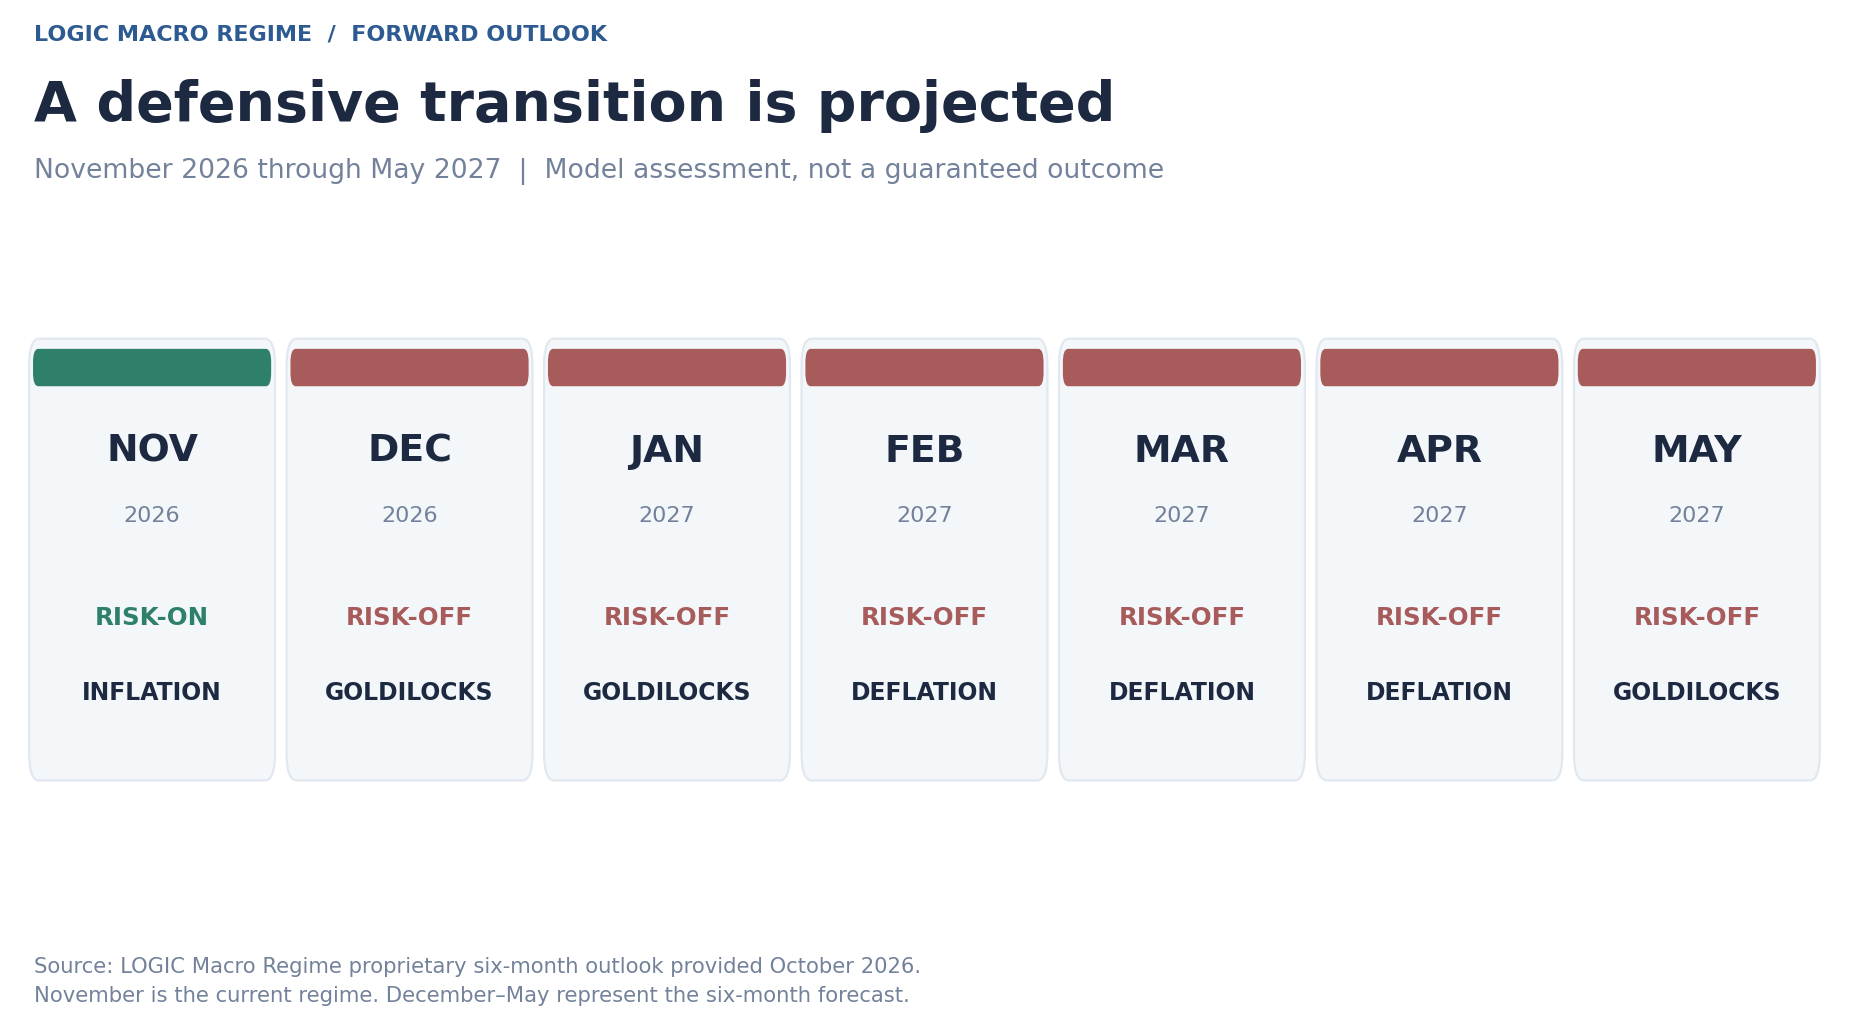
Chart 4. LOGIC’s November current assessment and December-May six-month projection. These are model scenarios, not guaranteed outcomes.
That path would change the relative opportunity set. Cooling inflation with improving growth is often supportive for risk assets. Cooling inflation because growth is deteriorating can instead favor higher-quality duration and defensive exposures, particularly if credit spreads widen and equity leadership narrows.
Our defensive interpretation would need revisiting if the dollar weakened sustainably, funding conditions eased, growth breadth recovered and market participation broadened. A forecast only becomes useful when investors know what could invalidate it.
The Bottom Line: Watch the Transmission, Not Just the Money
There is nothing inherently bearish about 3.4% GDP growth or 5.7% M2 expansion. The danger is assuming those numbers settle the investment outlook for the next six months.
We see a liquidity cycle that is still positive but losing momentum, restrictive financial conditions, weakening forward growth, stubborn inflation and increasingly fragile capital positioning. None guarantees a recession or a selloff. Together, they argue for paying closer attention to the transition than to the latest headline.
The market prices what comes next. The macro data usually confirm what has already happened.
Stay Systematic.